Introduction
In terms of developing Power BI reports and models, Power BI Desktop has long reigned supreme. However, being limited to developing in Power BI Desktop comes with at least 2 issues:
- It is not possible for data professionals using a MacOS computer to use Power BI Desktop
- Even when working on a Microsoft Computer, Power BI Desktop is found to be very resource intensive.
Hence I find it very appealing to aspire towards a paradigm in which in-browser development can be seen as an equally viable option. And we are closer than ever to arriving at that destination!
In the wake of Microsoft Fabric being announced, a number of huge improvements have been made to the browser development capabilities:
- Semantic Models can now be authored online, with the most recent additions to this functionality being full RLS Editor support.
- Workspaces in Fabric / Power BI Premium now supports native GIT integration to Azure DevOps repos, enabling cloud based version control and collaboration.
- Tabular Editor can still be used via the XMLA Endpoint to manipulate models in the Service, and recent changes got rid of the annoying limitation that any XMLA changes made to a model, made it impossible to download the model again.
- Working in the browser is as of yet the only way to leverage the DirectLake capabilities of Microsoft Fabric.
Below is a sample scenario, exploring the capabilities of developing a Power BI report, by solely working in the browser.
Creating a new semantic model in the browser
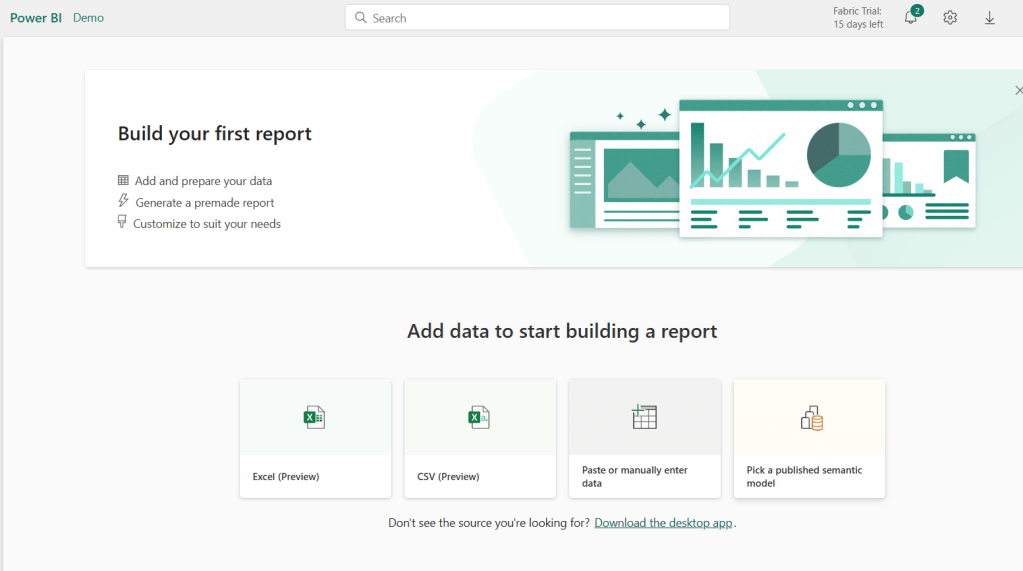
The first step of building a Power BI report is connecting to data. And one the few remaining limitations to browser development is actually found here: The limited number of data sources you can connect to, when you create a new report from the service.
Currently, you are limited to upload a file, or picking an existing published model:

Until we get more options for loading data into Power BI reports from the web creator (Which is on the roadmap!), picking a published model remain the only real choice for browser development. Hence, lets start by creating one such in a Fabric enabled workspace.
In my workspace, I have a Fabric Warehouse in which I have ingested a standard Contoso dataset. For guidance on ingesting data to a warehouse (or lakehouse for that matter), check out some of my other articles on the subject:
- Fabric for Data Analysts Part 1: Data Ingestion & Preparation – Downhill Data (downhill-data.com)
- Crazy or genius? Ingesting data to Microsoft Fabric / OneLake with Import Semantic Models instead of Dataflow Gen2 – Downhill Data (downhill-data.com)
- 5 ways to get your Dataverse Data into Microsoft Fabric / OneLake – Downhill Data (downhill-data.com)
- Ingesting API data to Microsoft Fabric with low-code Dataflows: A Practical Example using the Strava API – Downhill Data (downhill-data.com)
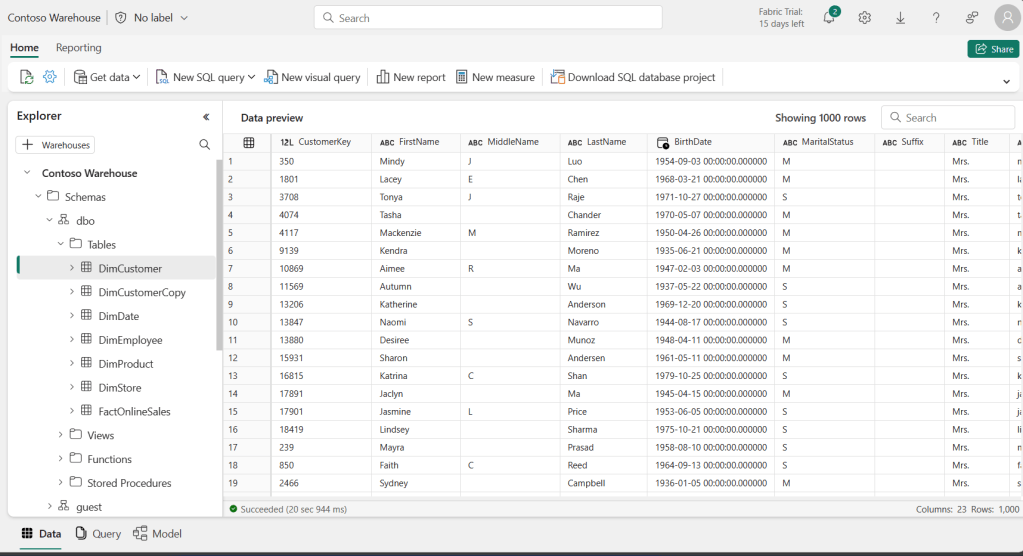
With data ready in my Wareouse, I can navigate to the reporting tab at the top of the warehouse, and create a new semantic model:


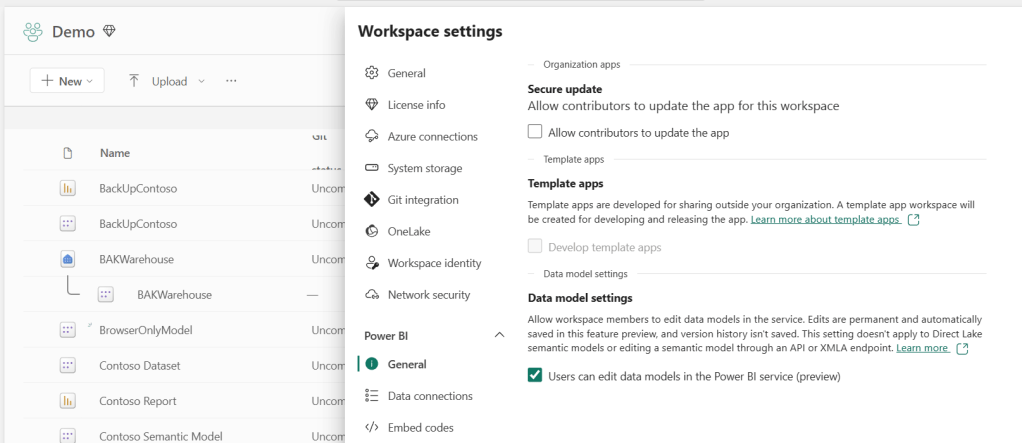
Once created, make you you enable the setting in your Workspace Settings to allow editing data models in the service:
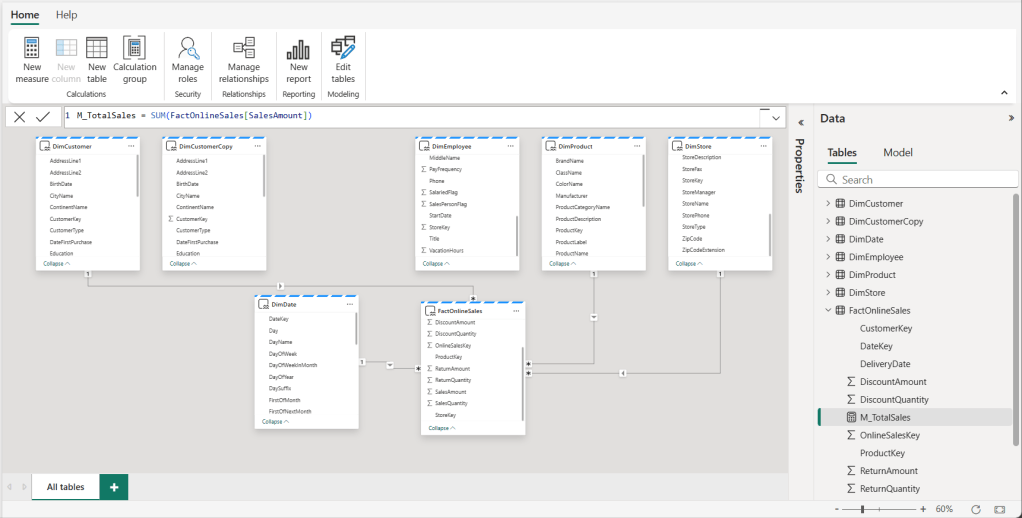
And I can now open my Semantic Model, enter Edit Mode, and add relationships:

Also notice here, that the Storage Mode for all the tables are DirectLake, meaning that we can take advantage of one of Fabrics major analytical advantages with this method:

In addition, we can add Calculated Measures, Calculation Groups and RLS rules to the model:


Creating a Power BI Report in the browser
With the model created, we finally have some data to connect to when creating a report:

You can choose to Auto-Create a report (which I find quite entertaining to play around with), or you can start from blank.

From the Edit Mode, you can accomplish most of the stuff you normally can in the Power BI Desktop Report View. Add and modify visualizations, add graphic elements, edit interactions, and even open up most of the secondary ribbon panes known from the desktop editor.
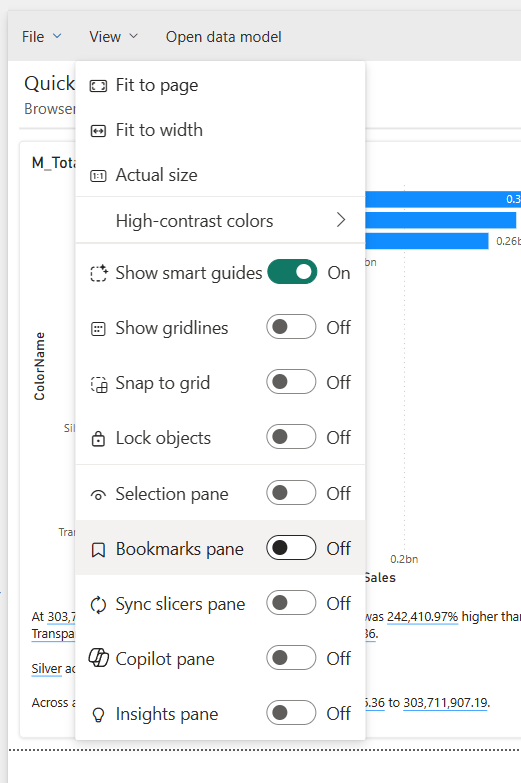
In terms of limitations and drawbacks, one of the frustrations of working in the online editor in my experience, is the inability to quickly switch between Report, Data and Model views. You will need to jump into the Semantic Model, or even into the underlying Lakehouse/Warehouse itself to get a glimpse of the data.
Another significant drawback is the inability to use the lightweight performance analysis tools of the ‘Optimize’ ribbon in Power BI Desktop. However, we can still do some performance analysis using external tools like DAX Studio. Which brings me to the next topic:
Using External Tools for browser based models
Using External Tools for developing models hosted only in the Service is easy, once you get past the initial access barrier.
First you need your Power BI/Fabric Administrator to enable the XMLA Endpoint for your Premium/Fabric Capacity. This takes place inside of the Admin Portal Capacity Settings:

Under Power BI Workloads, the setting you are looking for is the ‘XMLA Endpoint’, which depending on your use case, you need set to either Read Only or Read Write, instead of OFF:

Read is sufficient for connecting e.g. DAX Studio for Model Analysis, whereas Read Write is required if you wish to modify semantic models using Tabular Editor.
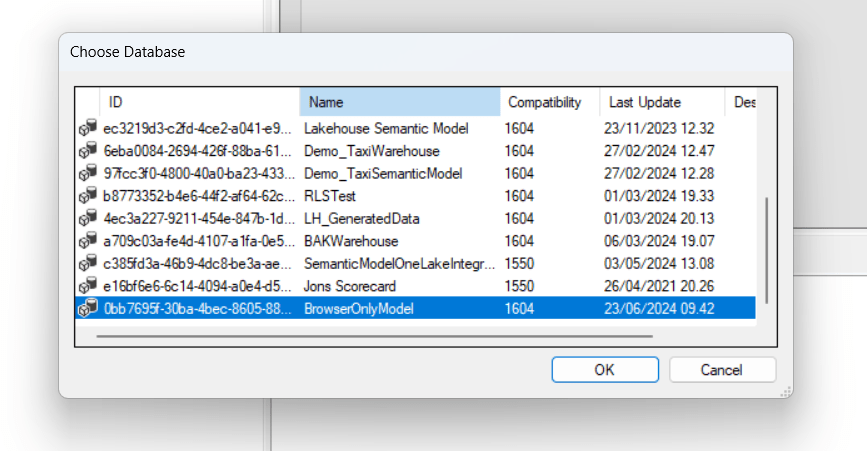
With the settings in place, you need to fire up your External Tool. As we are not using Power BI Desktop, you need to start the program directly from your installed applications. And in addition, we need to explicitly connect the External Tool to our model.

Login with your Microsoft credentials, and you’ll be able to pick from your semantic models:

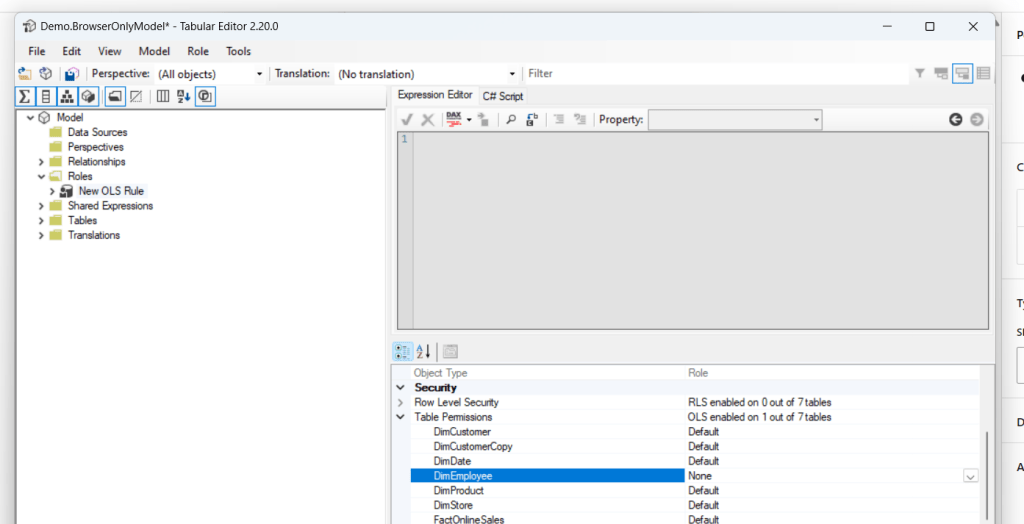
And now, I can make changes to the semantic model, adding new calculations, RLS rules and even OLS rules:
Versioning and Collaborative Development for Browser-Only development
Now, another commonly used feature of Power BI Desktop, is the ability to save your .pbix/.pbip files to network drives, OneDrive and Sharepoint for easy version control.
While this type of Version Control is not possible with browser-only development, we can leverage an even better feature: The GIT integration for workspaces.
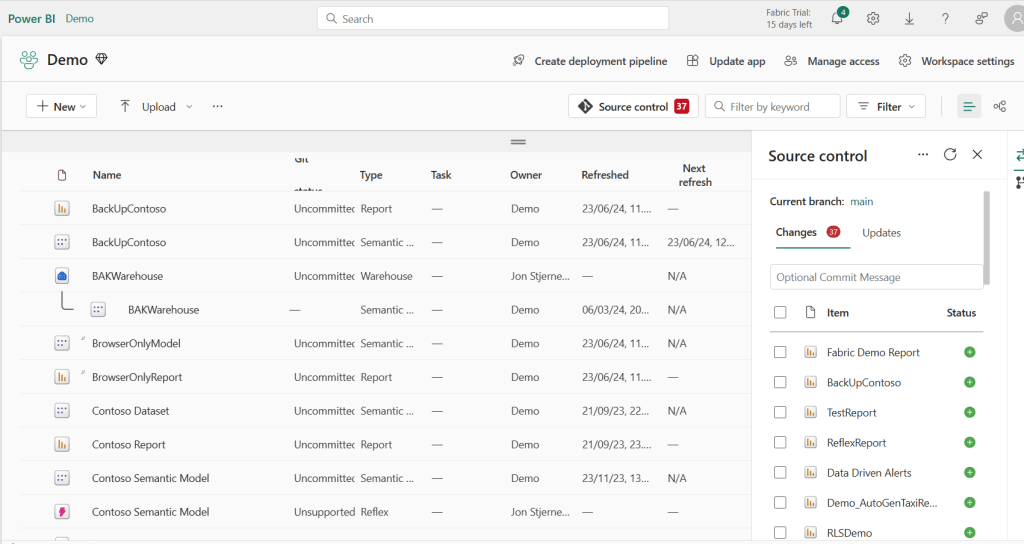
First ensure that your Fabric / Power BI Premium workspace is linked to source control in a GIT repo:

Then, after saving my changes in the Browser editor or from my External Tool, I can see and commit any changes made to items in my workspace, to the corresponding GIT repo:
One limitation, at the time of writing this in June 2024, DirectLake models are actually not supported for GIT, but it is on the roadmap for the near future.
You can of course expand on your versioning strategy, or get more detailed explanations, by employing any of the techniques that I have offered in my previous blogs on the topic:
Simple Version Control w. GIT:
Collaborative Development w. GIT:
ALM w. Deployment Pipelines:
Summary
I am a strong believer in leveraging the increasing potential of standard web browsers to improve accessibility of software, and I truly think we are getting closer to an OS agnostic Power BI / Fabric development paradigm.
Browser-Only development is your gateway to unlocking the power of DirectLake in Microsoft Fabric, and the methodology supports best practice Power BI development principles like separation of semantic model and reports. The method supports GIT Integration and Content Lifecycle Management through Deployment Pipelines, although GIT support for DirectLake models are still a few months out at the time of writing.
Some drawbacks still exist for Browser Development (No Optimize Ribbon for Power BI Reports, Some UI frustrations, and some features locked behind external tools), but overall we are close.


Leave a comment