Introduction
Recently, I’ve experienced a huge influx in requests from Microsoft Fabric customers wanting a good way for user’s to push data transformation upstream, following Roche’s Maxim:
Data should be transformed as far upstream as possible, and as far downstream as necessary.
To elaborate slightly, there are tons of Power BI Semantic Models out there which are performing a number of data transformation steps.
The problem with semantic model transformations are twofold:
- These model transformations consume resources on every model refresh – this can add up.
- If the same data is used in multiple semantic models, the same transformations might take place in multiple models. At best, this means that you need to update your logic in multiple places when changes are made back end. At worst, this means different outputs if different developers do not manage to align their transformation logic 100%.
As companies adopt Microsoft Fabric, the distance between backend artifact and Semantic Model is smaller than ever, and it feels more obvious than ever to push some of those local transformations to your Fabric Storage item of choice.
The question is. How do you do that? There are many options:
- SQL Views: SQL proficient Power BI developers may create Views with SQL in your Fabric Warehouse, Lakehouse SQL Endpoint or SQL DB in Fabric.
This obviously requires SQL skills, which many Power BI developers have, but definitely not all. Especially not all self-service developers. - Dataflows Gen2: The low-code crowd could use Dataflows Gen2 to take the otherwise local semantic model logic and make it either (1) shareable and consumable by multiple semantic models or (2) even persist the output of the dataflow in a table in a Warehouse/Lakehouse/SQL DB.
This is a quite “expensive” solution due to the nature of Dataflows Gen2 (yes, even after FabCon Europe 2025 optimization announcements). - Notebooks: The very savvy Power BI developer could use a Notebook for a more compute optimized way of persisting the logic in a table in your Gold/Curated/WhateverYouNameYourModelSpecificLayer in your Warehouse/Lakehouse/SQL DB.
While this is not necessarily harder than SQL in itself (you can even write SQL in your notebooks of course), I simply do observe that Power BI folks have quite a difficult time venturing into the Notebook world.
Now, while these are probably the most commonly seen scenarios, each with their own downsides, I want to spend a few minutes of your time today broaching another solution:
Visual Queries in Lakehouses/Warehouses/SQL DBs. which take the best from SQL and Dataflows Gen2 and mixes together in a low-code but-more-performant-than-Dataflows solution.
How to use Visual Queries to create Self Service Views and Tables in Microsoft Fabric
So how does Visual Queries work, and how would you let your users create them?
Let’s first have a look at creating a Visual Query:
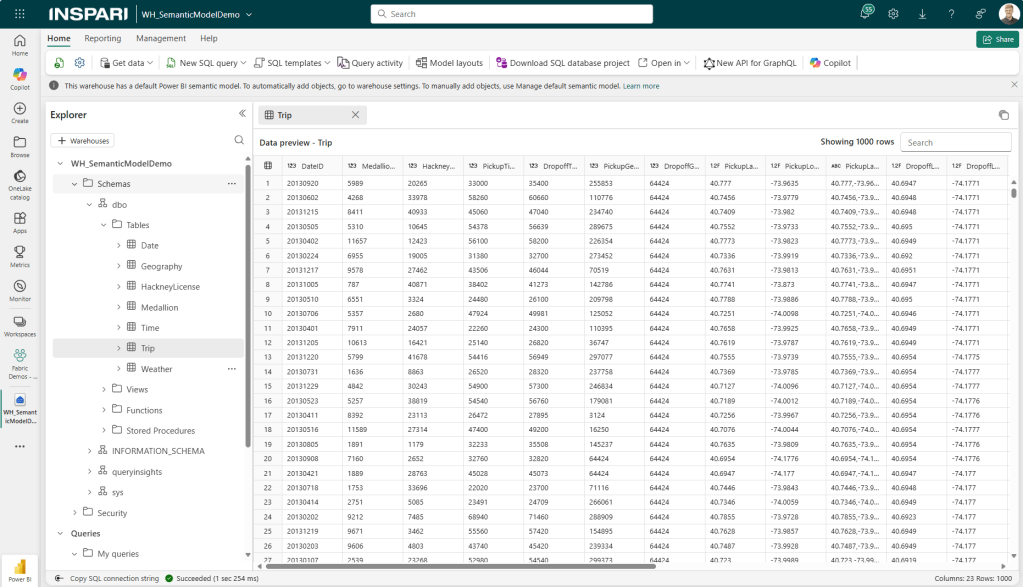
In this example, I have a Fabric Warehouse with the frequently used New York Taxi Sample dataset. I could have used the Lakehouse SQL Endpoint or a SQL DB in Fabric, but in this case I chose a Warehouse:
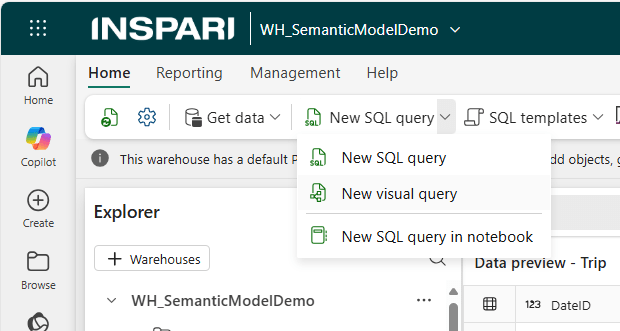
From the top ribbon, select New SQL Query > New Visual Query:
You are then presented with a (perhaps familiar if you are used to Dataflows Gen2 or the new online Power Query experience) canvas onto which you may drag and drop tables:
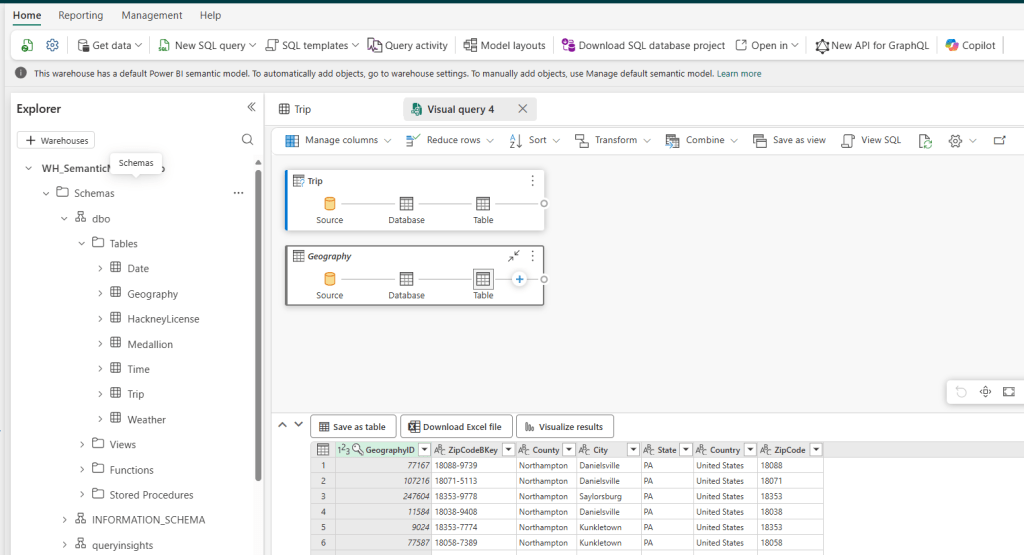
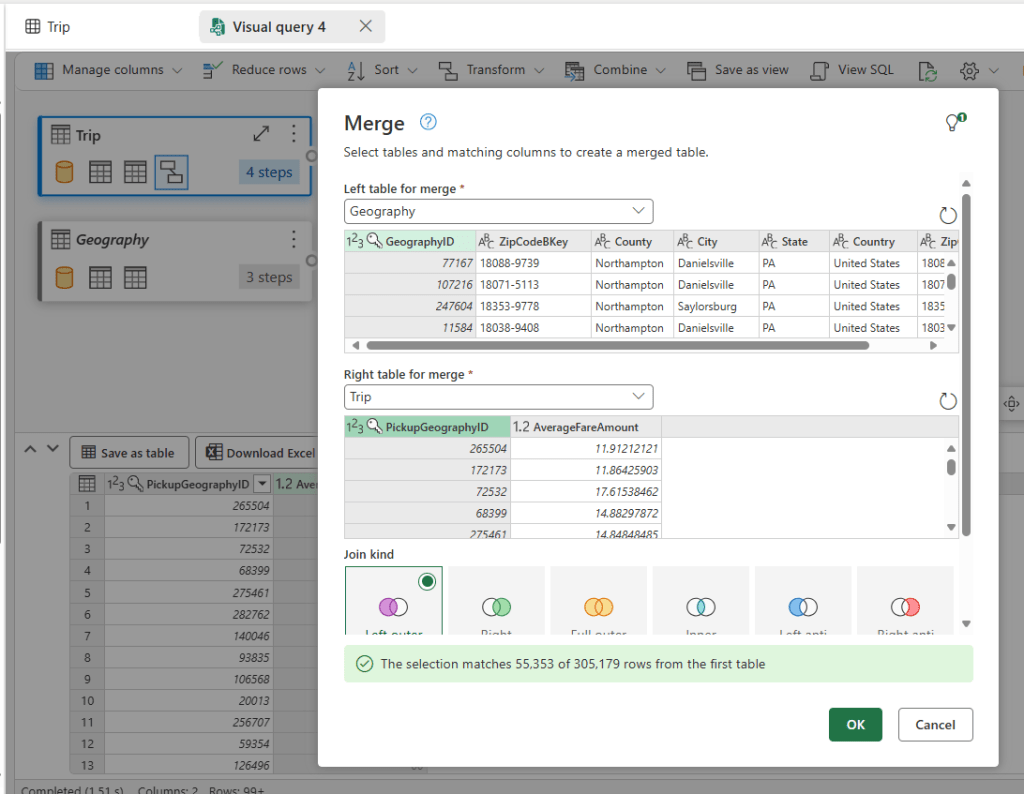
You may know choose from the available transformation, to remove columns, filter rows, merge tables and more. Note however that not all of your usual Power Query transformations are available, and hence not all cases may be solved this way.
After transformation, you’ll want to persist your query as a View or Table. To do this, there is one crucial step you must to: Enable Load for the query in question.
Especially if you’ve created new queries along the way, you’ll need to explicitly right-click your query in the diagram view and select the Enable Load option:
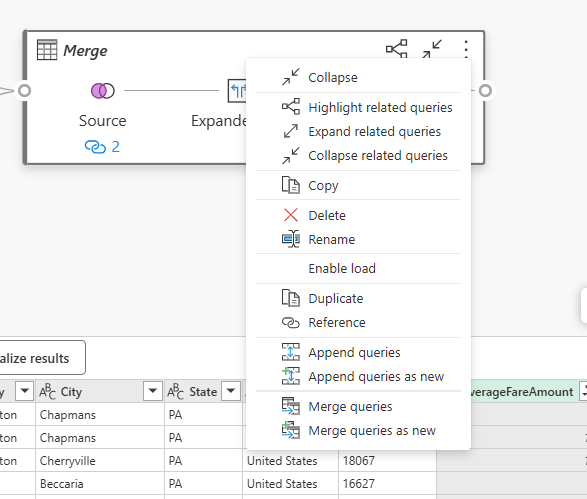
After enabling load, the options for “Save as View” and “Save as Table” will become available:

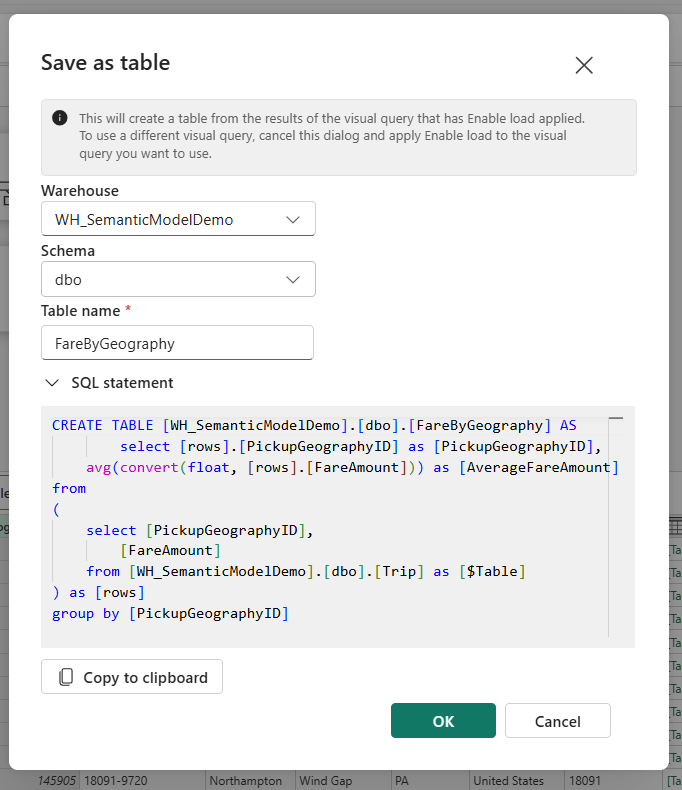
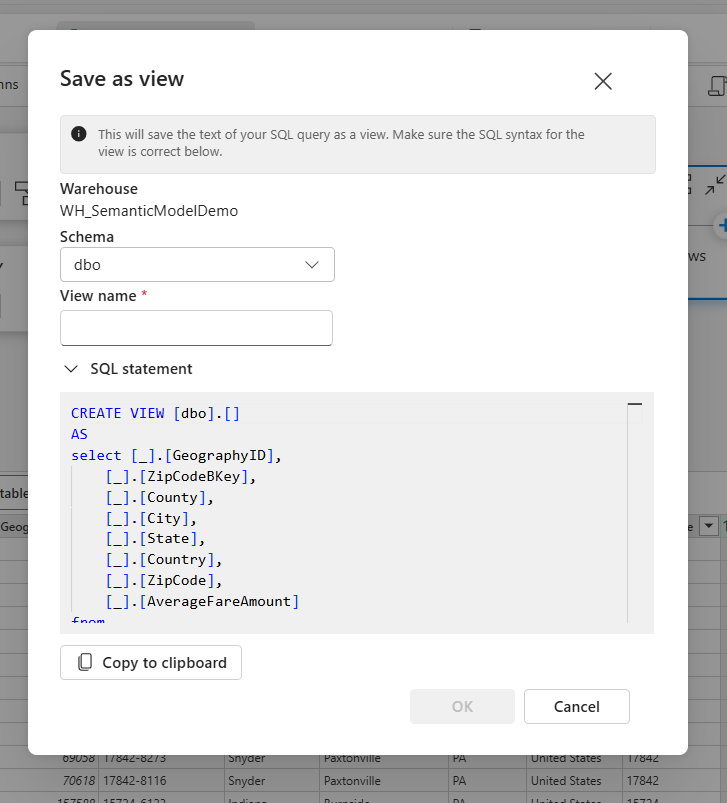
Each dialogue will auto-create similar, but slightly different SQL statements, and after naming your Table/View and hitting the green button, you’re off to the races:
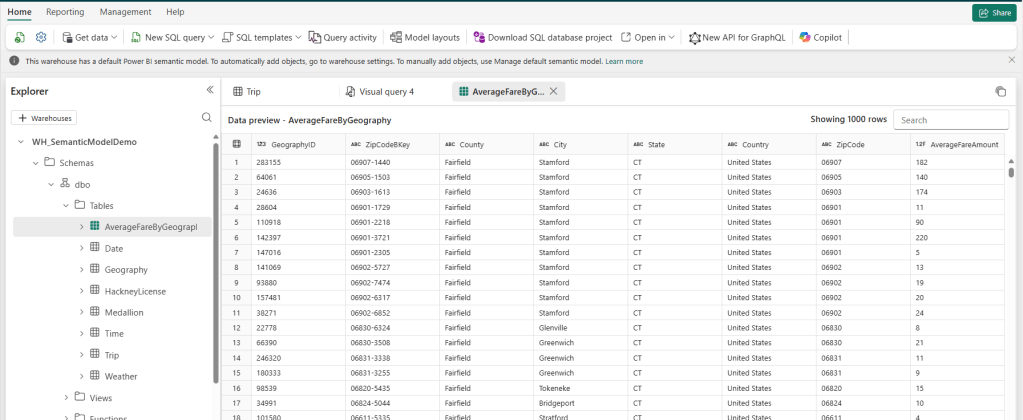
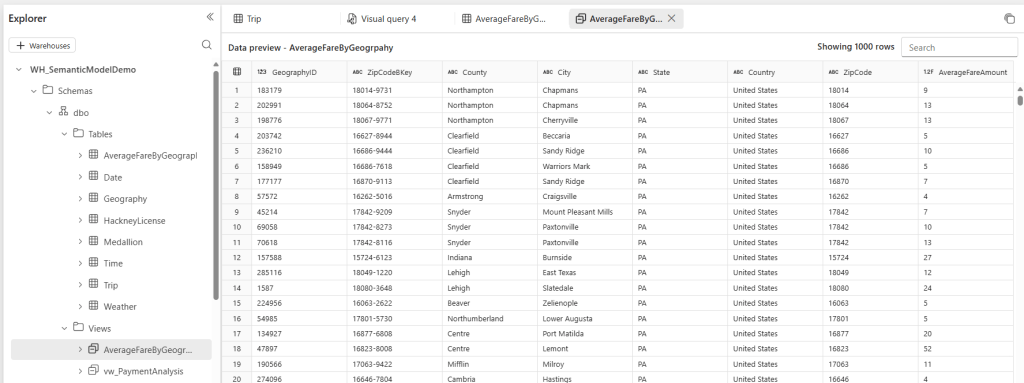
I can now query my table and view from within my Warehouse, and use those repeatedly within my Semantic Models or other data solutions in Fabric. And all I did was use a little bit of low-code magic in the visual query builder:


Leave a comment