Introduction
I have blogged at length about the integrations between Power BI and Power Apps.
I’ve shown how to get started with creating and embedding a basic Power App in a Power BI report for data write-back. Find the article here: https://downhill-data.com/2024/02/09/power-bi-write-back-part1/
We’ve covered how to display the write-back data live in Power BI with a DirectQuery connection. Find the article here: https://downhill-data.com/2024/02/10/guide-add-write-back-to-power-bi-reports-with-power-apps-part-2-display-write-back-data-live-in-power-bi-reports/
Another blog described how to layout your embedded Power Apps in Power BI. Find the article here: https://downhill-data.com/2024/02/12/guide-adding-write-back-capabilities-to-your-power-bi-reports-with-power-apps-part-3-sizing-your-embedded-power-app/
And last week, I showed how we can use Combo Boxes to trigger OnSelect events in Power Apps, without the user ever clicking in the App: https://downhill-data.com/2024/07/23/auto-trigger-onselect-button-actions-in-power-apps-when-selecting-data-points-in-power-bi/
In this article, you will learn how to use the same Power App in two different Power BI reports with different behaviour, and be inspired by potential use cases.
Passing Parameters to Power Apps from Power BI
In the first Parts of this article series, we have multiple times been adding Fields from our Power BI model to our Power Apps.
The process is pretty simple, with a quick overview of the process being as follows:
- Create a Power Apps for Power BI visualization in your Power BI report in the Power BI Service.
- Add your Fields to the Fields list of the visualization
- ‘Edit’ the visualization, to open Power Apps Studio in a new browser tab.
- Retrieve the data sent to Power Apps via the PowerBIIntegration.Data element.
For a more in depth guide, check out Part 1 of the series, which is linked at the top of this article.
However, in addition to passing normal data fields to your Power Apps, you may also send Calculated Measures. To do this, simply create any kind of Calculated Measure in your Power BI.
You may create a hardcoded value to be retrieved in Power Apps:
M_AccessParameter = “Admin”
Or you may create a dynamic parameter, which takes respect to filters being applied in your report:
M_DynamicSalesParameter = “SUM(Orders[Sales])
To use these parameters in Power Apps, simply add the Calculated Measures to the Fields list of the Power Apps for Power BI Visualization, like you would any normal field.

In Power BI, the value can be retrieved in a number of ways with the PowerBIIntegration.Data element. The important thing to know is that PowerBIIntegration.Data returns a table. Hence, you may use a formula like below, to extract a hardcoded measure:
First(PowerBIIntegration.Data).M_AccessParameter
Or you may use a function, to return the dynamic output from your dynamic parameter, depending on the filters applied in Power BI:
Max(PowerBIIntegration.Data, M_DynamicSalesParameter)
Use Case Ideas for Parameterizing your Power App
Once the value from the Calculated Measure is correctly loaded in your Power App, you can use it to alter the behaviour of your Power App, depending on which Power BI Report is used to call the app.
You could…
Use a hardcoded Calculated Measure to make your App relevant to multiple audiences, by show/hiding controls in your Power App (e.g. a Control Panel for Admin Users), depending on which Power BI Report is calling the app.
Imagine two different Power BI Reports. One for Management (Report A) who needs to be able to access an Admin Panel in the Power App, and a slightly different department-specific report (Report B) with no Admin Panel access.
To solve this, in Report A, Create the Calculated Measure:
M_AccessParameter = “Admin”
And in Report B, Create the Calculated Measure:
M_AccessParameter = “User”
In Both reports, add the Calculated Measure to the field list of the Power Apps for Power BI Visualization.
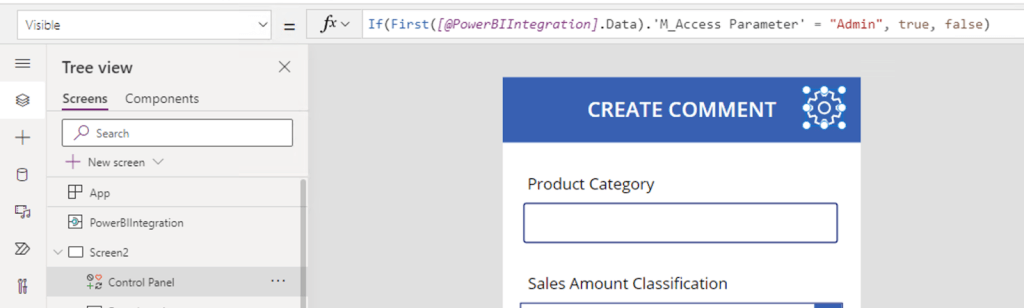
In Power Apps Studio, add conditional logic on the Visiblity Property of one or more of your controls. E.g, change the Visiblity Property on your Control Panel button to:
If(First(PowerBIIntegration.Data).M_AccessParameter = “Admin”,
true, false)

Or you could…
Use a dynamic Calculated Measure, to auto-complete certain values in your Power App (e.g. the default value of a dropdown), depending on dynamic calculations in Power BI, leveraging the full computing power of Power BI.
Imagine a Power BI Report that contains a DAX calculation to get Sales Amounts. The calculation is being filtered by multiple filters.
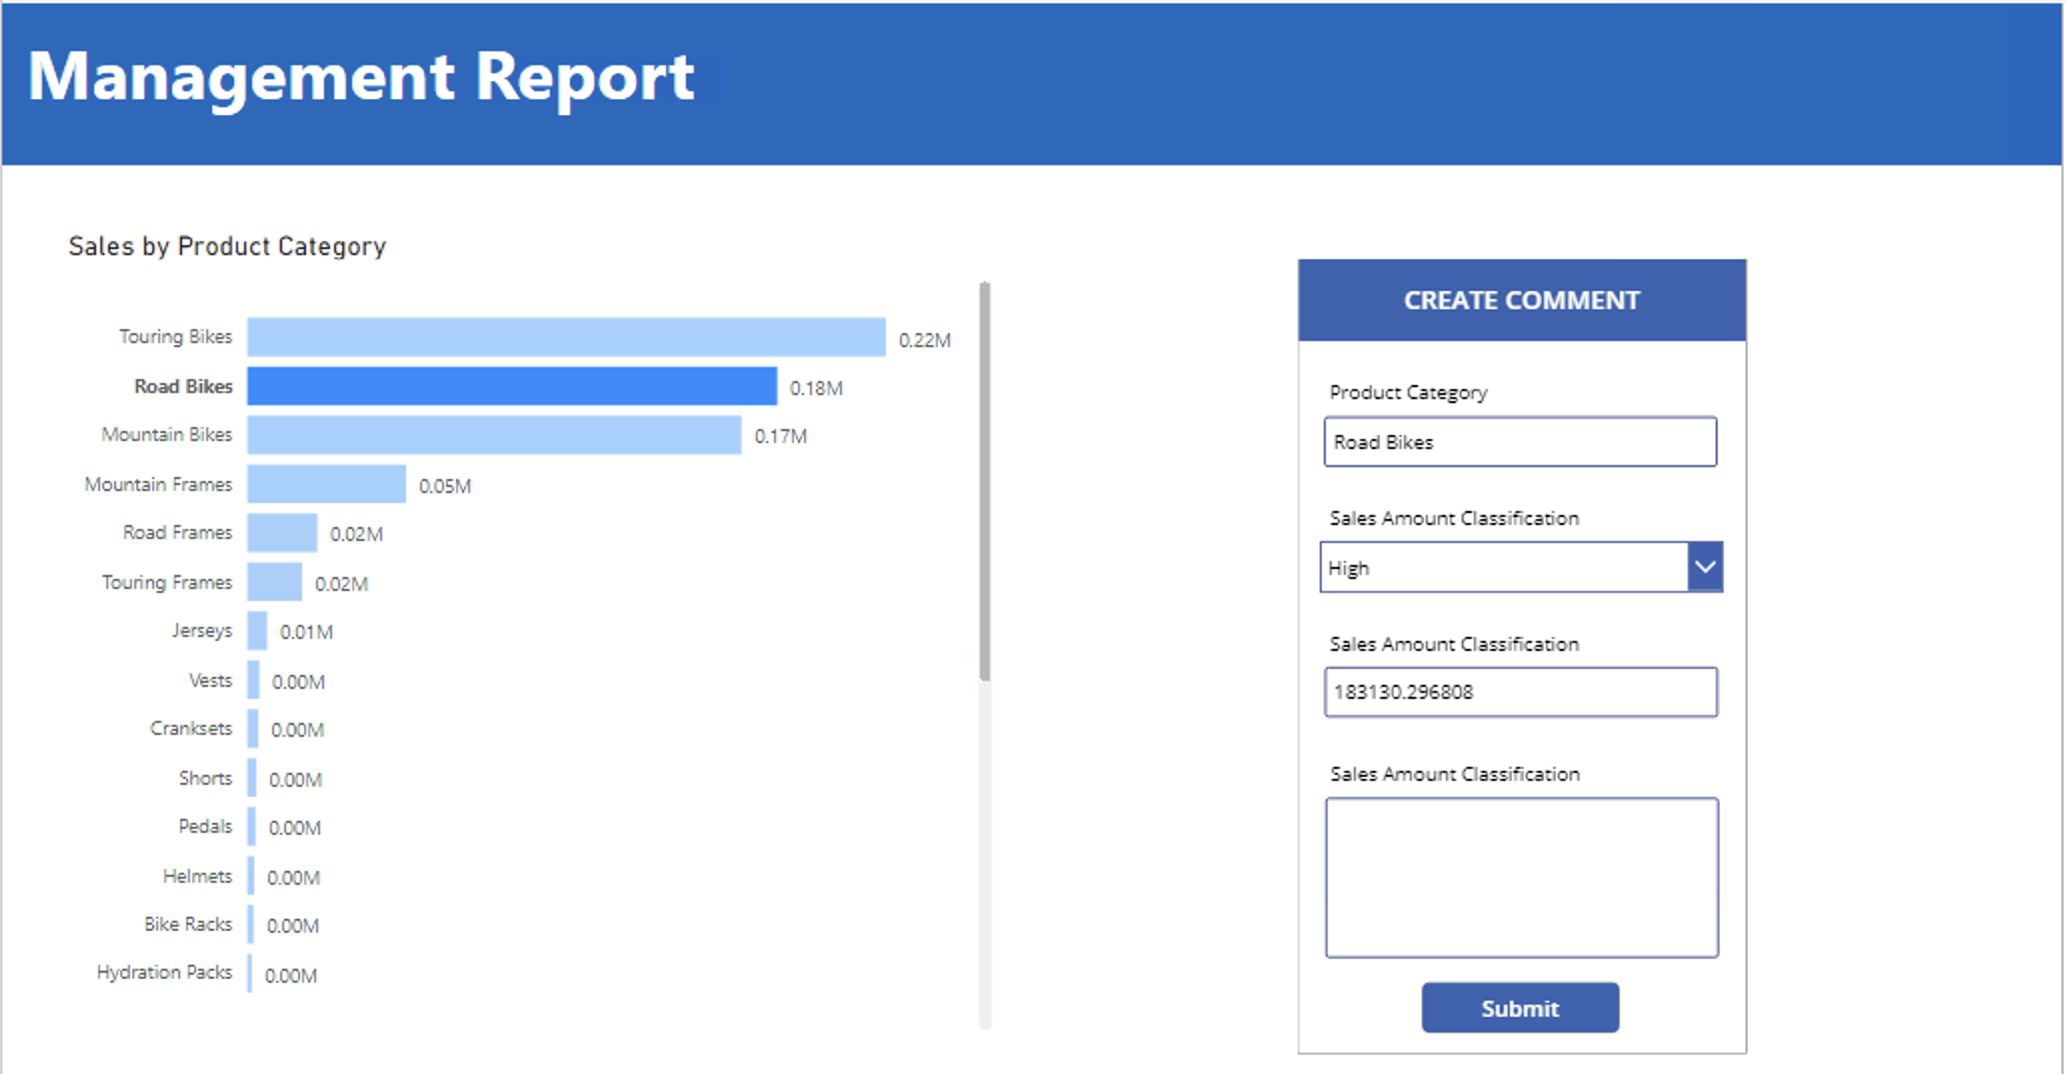
In the same report is a Power App, where users should add comments, and in a dropdown indicate the level of the Sales.

To solve this, Create the Calculated Measure for your Sales amount:
M_DynamicSalesAmount = “Insert Your Own Calculation”
Add the Calculated Measure to the field list of the Power Apps for Power BI Visualization.
In Power Apps Studio, change the default value of a dropdown control, to conditionally check the value of the Measure. E.g:

And observe how the Dropdown value will now automatically change!
Also consider populating the rest of the controls’ default values, to ensure proper data quality throughout the entire input:
But the use cases do not stop there…. You could also:
Use a hardcoded Calculated Measure to alter which data source you are writing data back to with your Power Apps.
Imagine two different Power BI Reports. One for Management (Report A) that displays all data, and a slightly different department-specific report (Report B) filtered via RLS to only the current user’s department.
In each report, users need to submit comments to a write-back data source, but for security reasons, the management and department-specific comments are not allowed to be stored in the same table.
To solve this, in Report A, Create the Calculated Measure:
M_DataSourceParameter = “Management”
And in Report B, Create the Calculated Measure:
M_DataSourceParameter = “Department”
In Both reports, add the Calculated Measure to the field list of the Power Apps for Power BI Visualization.
In Power Apps Studio, add conditional logic to your Patch Statement for submitting your Comments. E.g:
On Select:
Patch(If(First(PowerBIIntegration.Data).M_DataSourceParameter
= “Management”, ‘dbo.ManagementComments’, ‘dbo.DepartmentComments’),
Defaults(), {Comment: ti_CommentInput.Text})
Or you could…
Use a dynamic Calculated Measure to change the value of a dimension in your write-back data
Imagine two different Power BI Reports. One for Management (Report A) that displays all data, and a slightly different department-specific report (Report B) filtered via RLS to only the current user’s department.
In each report, users need to submit comments to a write-back data source, but in a column the name of the User’s department should be stored.
To solve this, in Report A, Create the Calculated Measure:
M_DepartmentParameter = “Management”
And in Report B, Create the Calculated Measure:
M_DepartmentParameter = Selectedvalue(UserTable[Department])
In Both reports, add the Calculated Measure to the field list of the Power Apps for Power BI Visualization.
In Power Apps Studio, add conditional logic to your Patch Statement for submitting the comment with Department. E.g:
On Select:
Patch(‘dbo.DepartmentComments’, Defaults(),
{Comment: ti_CommentInput.Text, Department:
First(PowerBIIntegration.Data).M_DepartmentParameter})
Summary
Power BI reports can be used to send parameterized values to Power Apps, by using Calculated Measures.
You can send both hardcoded values, or dynamically calculated values which leverages the Power BI computing engine, to conditionally show/hide controls in your Apps, or make controls behave differently, depending on the Parameter value.


Leave a reply to One Embedded Power App; Multiple Landing Pages – Downhill Data Cancel reply