
Introduction
Power BI Reports on TV Screens are a work of art. They need to be curated with extra care, as interaction between user and report is (usually) not possible or very limited.
Further, in terms of technicalities, the report needs to be displayed with as few distractions as possible, and it needs a way to refresh itself.
This article will give you a few pointers to getting started.
Design Considerations
When designing for TV, you need to take KISS-principles even more literally than for normal report development. You need to display any viewable object in sufficiently large, clear and distinct format, to allow users to distinguish between numbers and make comparisons.
Tables become an even greater ‘no-no’, and Charts should include fewer items whenever possible, with distinct coloring separating categories as needed.
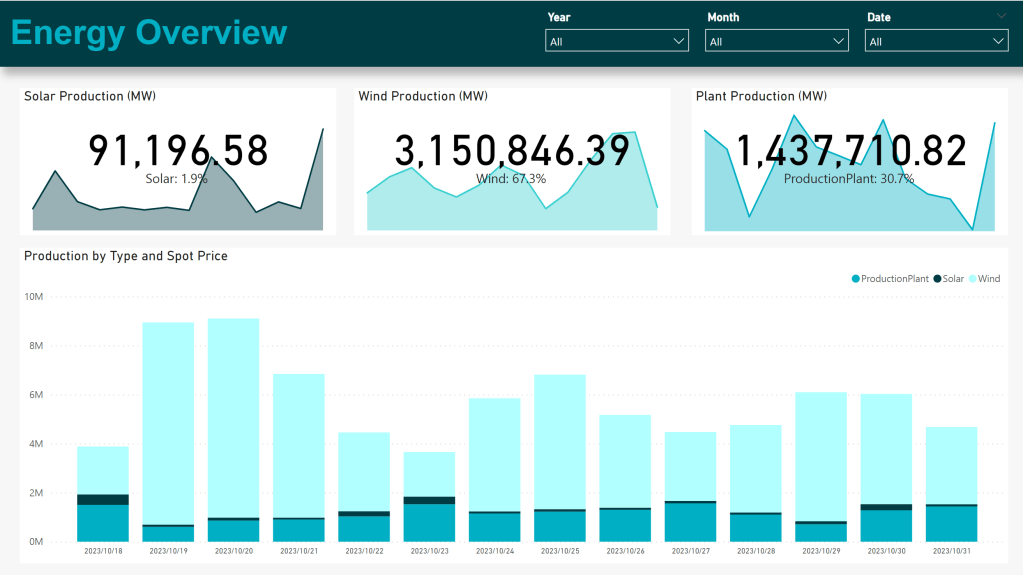
An example of a report which may be suitable for TV-reporting, could look something like:
Displaying the Report
Depending on the TV on which you are to display the report, you may need to make different decisions.
- Are you opening the report by using a browser that is built-in to the TV?
- Is your TV hooked up to display contents from a PC, but one which has limited ability to be interacted with?
- Or are you simply Casting/Sharing the screen of a fully functional PC onto the TV screen?
Depending on your answer to the question above, you may need to take advantage of one or more of the tips below:
To App or Not To App?
The question of whether to open your TV Report directly from the Workspace, or from within a Workspace App, is not always conclusive.
If you need to be able to cycle between multiple reports, the answer is a resounding ‘Use a Workspace App’! But if you are looking to only ever display the same report, you could choose either.
If you decide to go with the Workspace App, you may consider hiding the Navigation Pane of the App by default:

This is especially important in a paradigm in which you may not be able to interact with the report after it is loaded (e.g. using a built-in TV internet browser).
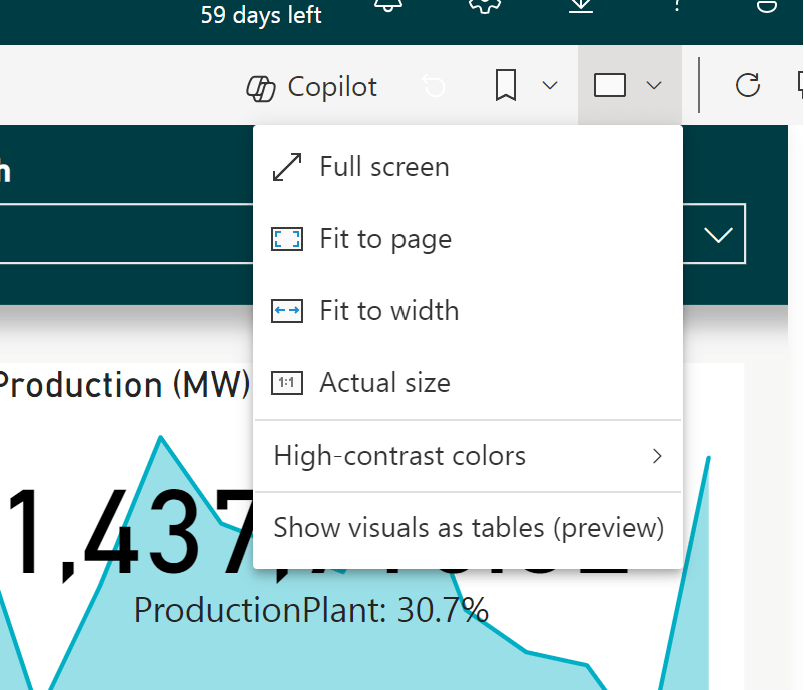
However, if you have the option to interact with the report, you should attempt to enter Full Screen Mode:
Another must-do, regardless of your implementation, is to hide the Filter Panel, as this will show even in Full Screen Mode, both in Workspace Apps and Workspaces. The Filter Panel can be hidden either from Power BI Desktop, or by going into Edit mode of the report:
Automatic Page Refresh
After all the visual setup has been done, you need think about data refresh. Even if you are using Direct Query/Direct Lake, you will need to perform a visual refresh of your report every once in a while, to bring new data in.
This can be done by applying the ‘Automatic Page Refresh’ functionality from the Report Formatting pane:
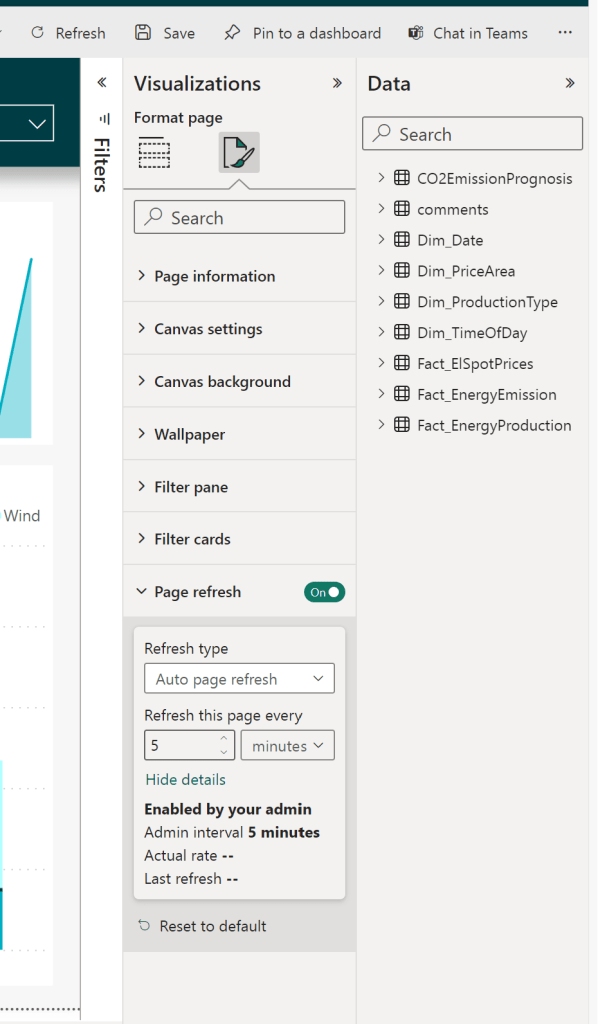
Note that this setting needs to be enabled in your Tenant Admin Settings to become available.
Also note that the refresh frequency possible for you to use depends on your Licensing/Capacity scenario. For Shared Capacities it is not possible to refresh more frequently than 30 minutes. For further details, see the official documentation: Automatic page refresh in Power BI Desktop – Power BI | Microsoft Learn
Summary
Power BI Reports are powerful even as static reports displayed on TV-Screens. Just make sure to make the proper adjustments to layout and design, to make the contents even simpler and easier to digest.
Further, make sure to consider the technical aspects of refreshing your visuals.


Leave a comment