Introduction
Yesterday, I participated in the Swedish Power BI User Group to discuss a topic that has been heavily on my mind since the introduction of Microsoft Fabric.
As a Power BI user and Data Analyst, how will I fare on a Platform with so many possibilities, and yet so many requirements? What will my place be in the Data Ecosystem, and what should I learn to position myself the best way possible?
In the world of Data Analytics / Business Intelligence, I believe most have a perception of a few classic roles we may see in our departments:

Microsoft Fabric embraces all of these roles, but if one shines above the rest it is that of the Analytics Engineer, who is also the focal persona of the official Microsoft Fabric certification: My Experience and top tips for the Fabric Analytics Engineer Associate Certification (DP-600) – Downhill Data (downhill-data.com)
The Study Guide for the DP-600 is ridiculously comprehensive, and there is no way any one person can know it all. But yet, I have a strong belief that Microsoft Fabric carries enormous potential to elevate Data Analysts into this Analytics Engineering role.
The purpose of this article is to shed light on the purpose of the different data roles, as well as breaking down how a potential roadmap towards Analytics Engineering from a Data Analyst perspective may look, focusing on what the Analyst knows best.
A brief tour of data roles and information workers in IT academic literature
Before we expand on this roadmap from Analyst to Engineer, allow me to briefly turn our attention to what academic literature on the subject has to say about the subject of roles in data.
The goal of Business Intelligence and Analytics work, of Data Platforms and of Data Teams in general, is historically said to be Insight generation. In the past decade, attention has narrowed to Actionable Insight. That is, insight which enables immediate action by a capable user.
The general approach for arriving at Actionable Insight can be broken down into steps of the Data & Insight Supply Chain:
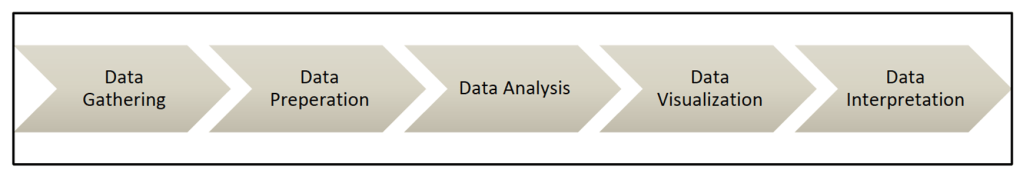
And the steps along this supply chain may be the focus of one or more Data Roles.
Information consumers are business analysts with lots of actual business know how. They work at the end of the insight supply chain, and interpret data that is presented to them. They have no power over the early parts of the chain, and have no technical background to help them take ownership of data products.
But if we take those information consumers and empower them with say… Excel? Which doesn’t have a huge technical barrier of entry?
Then we get Information Producers who are able to take ownership over data sourcing, preparation and to some extent preparation. They will primarily perform descriptive analysis, and their work will be manual with little to no automation and high technical debt.
If we empower those users further, with something like Power BI? Which is exactly what has happened over the course of the past 9 years?

We may inspire 2nd Gen Information Producers who are capable of automating their repetitive work, produce better downstream results and better share their findings with their peers.
Some information workers might be more concerned with Data Foundation Challenges. They may be existing Information Producers wishing to work further upstream in the insight supply chain, or they may simply start their career working with data foundation.

In those users, often empowered by SQL, we find Information Engineers who uses code first approaches to data ingestion and transformation. They optimize those parts of the insight supply chain for reliability, performance and reusability, empowering their organisation to retrieve more actionable insight.
Now in the IT literature, the final role we should mention is that of the Information Collaborator. Those are the information workers who want to make their organisation more data driven. They translate business requirements between each step of the insight supply chain, and they may help setup the technical foundation around each process.
Altogether, we can summarize the literature on Information Workers in data as below:

Fabric = New Opportunities, and New Requirements
It is likely no surprise that the IT literature data roles may be translated into the roles that we all know about already.

If we take a look at Microsoft Fabric in the context of these information workers, I would argue that Fabric indeed is a tool to foster more Information Collaborators/Analytics Engineers, and indeed a more data driven organisation.
The reason?
Fabric brings multiple different ways of accomplishing data tasks to the table, with very different degrees of technical expertise required. All of a sudden, our Analysts and Engineers may start to act like Analytics Engineers, if they leverage the tools available to them correctly.
So… What does Microsoft expect the role of the Analytics Engineer to facilitate in the context of Fabric? Quite alot…..
If we approach the Study Guide for the DP-600: Implementing Analytics Solutions Using Microsoft Fabric certification, we get an incredibly vast amount of topics to learn: Study guide for Exam DP-600: Implementing Analytics Solutions Using Microsoft Fabric | Microsoft Learn
As an Analyst, this is how I felt reading the study guide:
There is just so much to choose from.
A Roadmap for aspiring Analytics Engineers
But I will firmly stand by, that Fabric is a blessing for all ambitious Analysts who want to take their career to the level. Each new requirement, tool and skill is an opportunity for learning. It is just a question of starting with the things that comes easiest to you, and expand from there.
If we simply take the headlines of the Study Guide, we get a pretty good outline of a roadmap that we can work from:
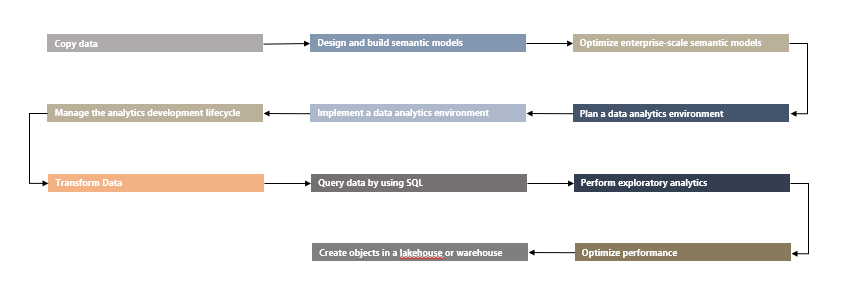
This roadmap is obviously quite high level, so let’s assign some highlights and tool/skill focuses for each.
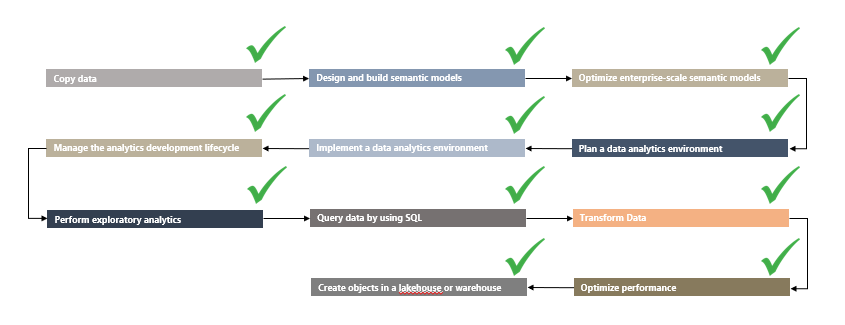
If we start out with the tools familiar to most Data Analysts who are used to working with Power BI, we actually have a super comfortable way to cover the initial three topics:


Now of course, the study guide talks about pipelines and notebooks for copying data too. But you really do not need to worry about that at first! Start by using the tool you know (Power Query / Dataflows), and explore the other tools later!
When we are comfortable with our core skillset, we can expand and try to understand the platform we are working on. By getting to know the general structure of a Fabric Data Platform, we are not only enabling a full low-code Data Platform, if that is what we desire, we are also setting ourselves up for success in the long run. Understanding the foundations of Fabric and best practice development on the platform, is not a very technical task. Hence, this is very approachable for an Analyst as well:
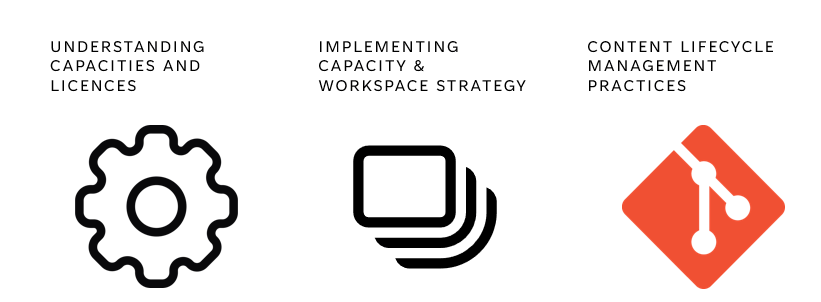
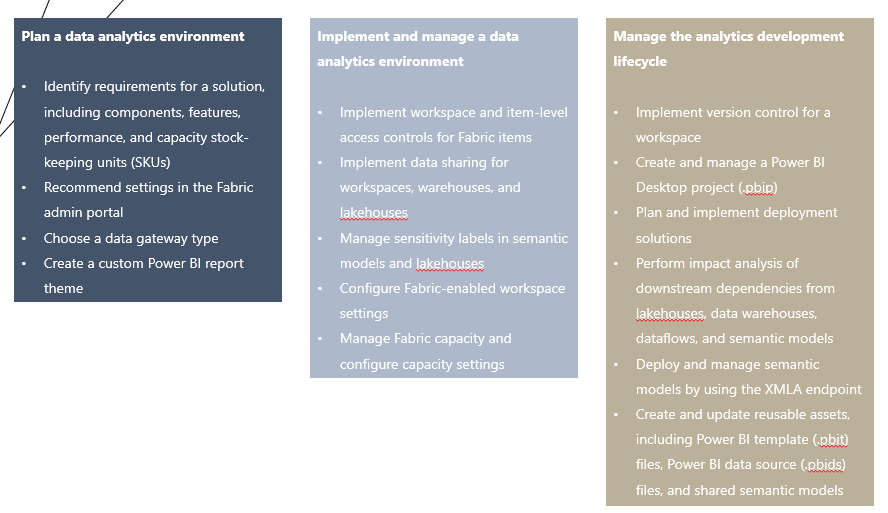
After understanding Capacities, Workspaces and Content Management, we can start taking a jab at the slightly more Engineering/Code heavy experiences, leveraging Data Pipelines and SQL to branch into the earlier steps of the insights supply chain:


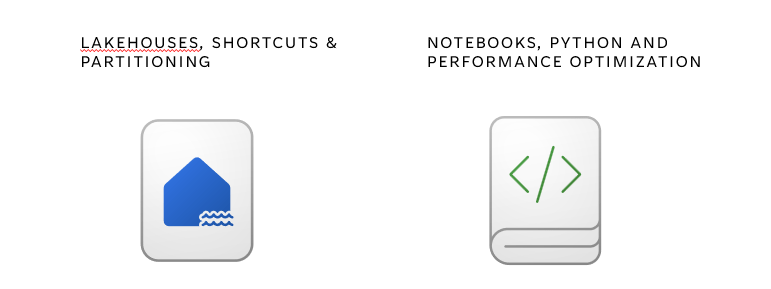
And finally, if we so desire, we can branch out into the Lakehouse architecture, Notebooks, Python and Spark, to complete our Analytics Engineering transformation:

Closing Remarks
Now of course, you will need to figure out your own way for learning each of these subjects. Nothing beats real experience though, so I would highly suggest leveraging the Fabric Trial for a free Fabric Enabled Workspace to build a bunch of demo solutions in.
I have collected a few other tips and tricks in a previous DP-600 article, with some resources you may check out: My Experience and top tips for the Fabric Analytics Engineer Associate Certification (DP-600) – Downhill Data (downhill-data.com)
In the end, I have no doubt that you too in no time will feel like the Swiss Army Knife of your data team, and be ready to tackle the DP-600 certification.


Leave a comment