
Introduction
Often I hear that people are worried about the costs associated with Real Time Intelligence in Fabric. For Eventstreams, I was able to find decent documentation stating the Capacity Unit consumption.

However, I personally thought it would be nice with a bit more of a practical example. Hence, I decided to do a small test on an F8 Capacity, to see how much of the Capacity running a few simple Eventstreams would consume.
Data
I am benchmarking the low volume Bicycle Sample Data against the high volume Stock Sample.
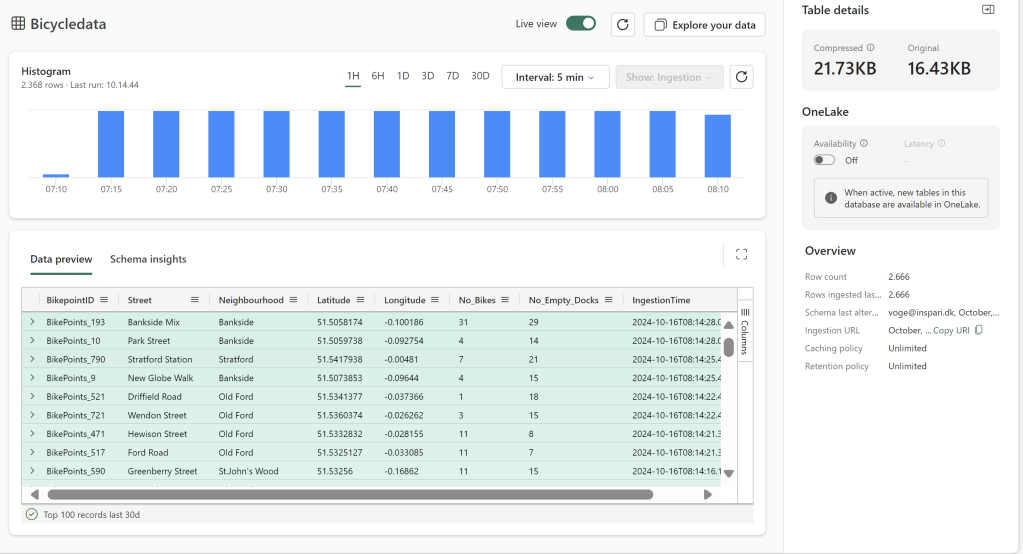
The Low Volume Bicycle Data passes through ~20KB of data spread over ~2370 events every hour:
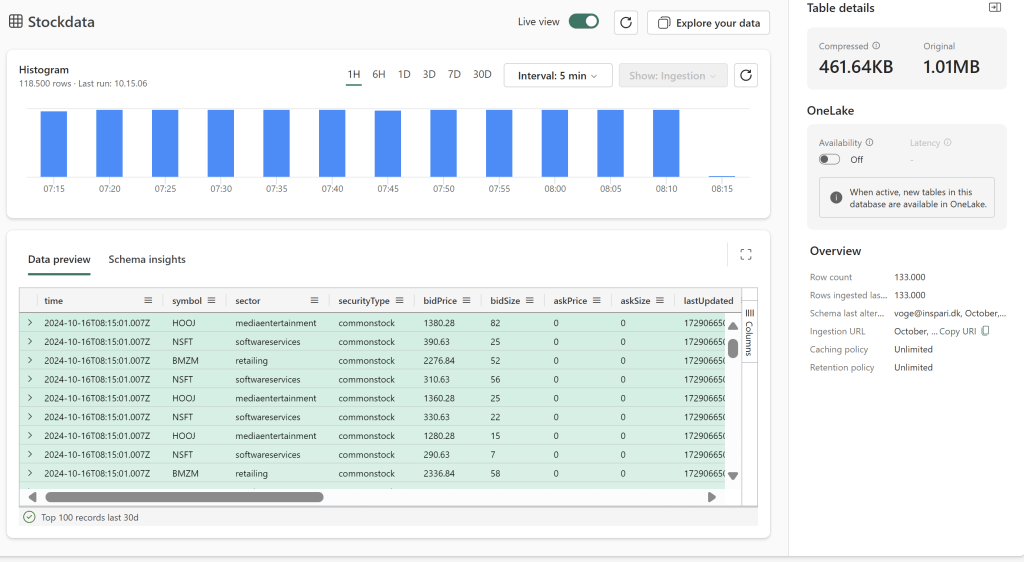
The High Volume Stock Data passes through about 1MB data spread out over ~118000 events per hour:
To compare the results, I am using the Fabric Capacity Metrics App: What is using up all my Microsoft Fabric Capacity? A quick guide to installing and using the Fabric Capacity Metrics App – Downhill Data (downhill-data.com)
We will look at the CU consumption over the duration of a full hour to make our analysis.
Eventstream Consumption
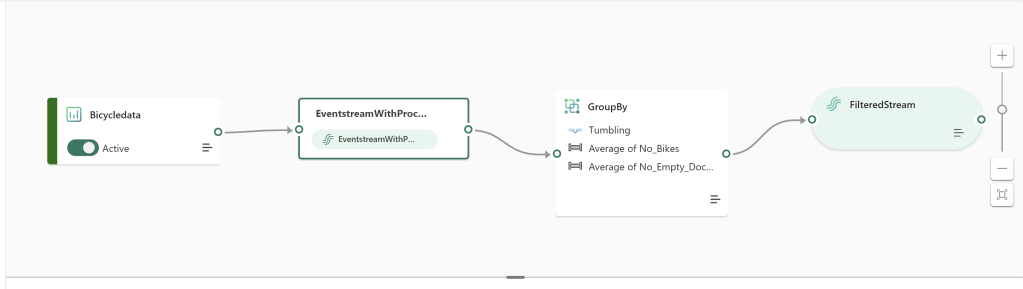
The eventstreams are built simple, like seen below, with no transformations taking place:

The results show that the Eventstreams are not too far from each other in terms of Capacity Unit Seconds (CU seconds) spent.

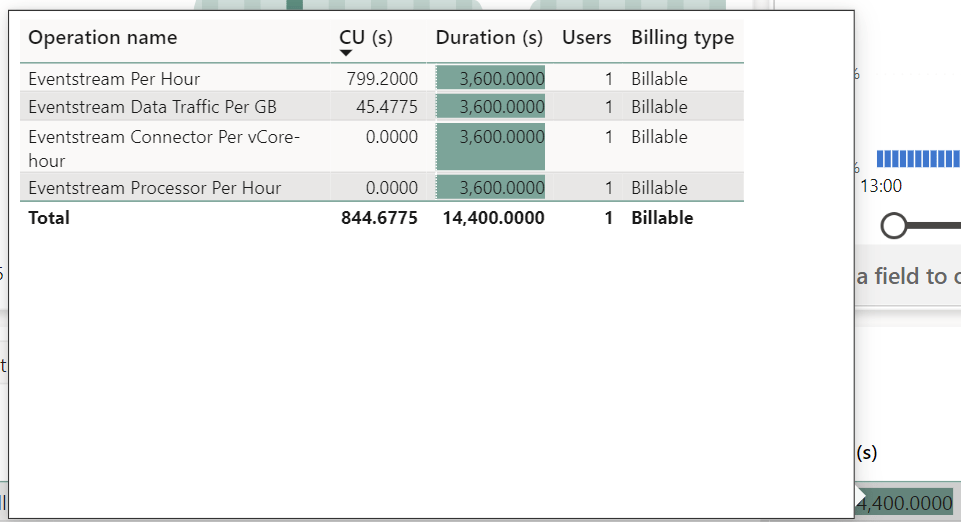
Running for one full hour, the high volume consumes ~44.3 CU seconds more than the low volume. Note that the duration looks funny, as the Item in reality contains four operations, visible on the breakdown tooltip below.
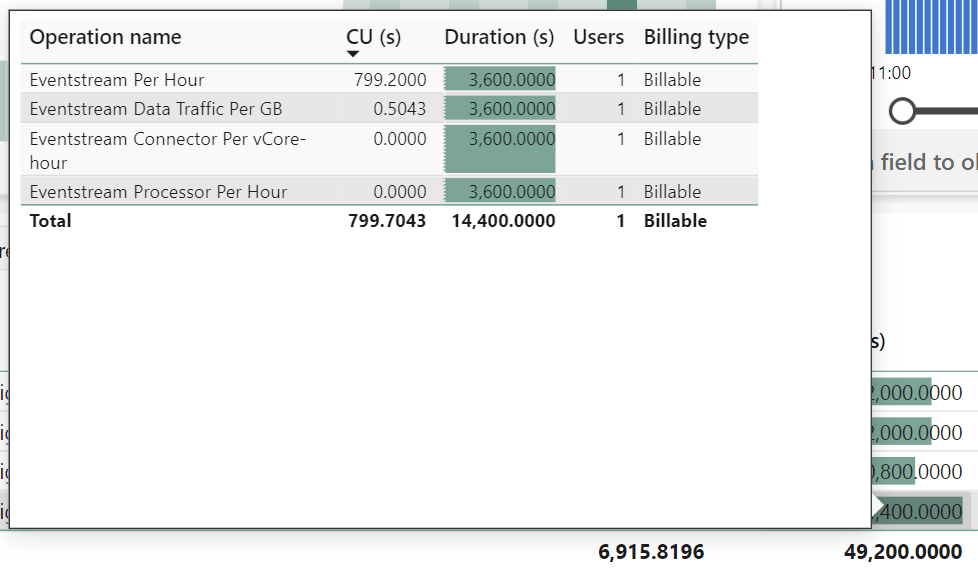
Looking at the breakdown on sub-items below, it is clear that most of the Eventstream consumption comes from simply running the stream. The consumed Capacity Units for one hour of 799.2 CU seconds equates 799.2/3600 = 0.222 CU pr. hour, which is exactly what is listed in the documentation: Microsoft Fabric event streams capacity consumption – Microsoft Fabric | Microsoft Learn
On an F8 capacity, this equates to (0.222 CU used pr. hour) / (8.000 CU available pr. hour) = 2.8% of an F8 Capacity used, to keep an Eventstream alive.
The full difference between the two Eventstreams comes from the Data Traffic operation, which make up only about 5% of the total CU consumption for these data volumes.
High volume (Stock sample):
Low volume:

| CU Seconds per hour | CU’s per hour | % of F2 Capacity | % of F8 Capacity | % of F64 Capacity | |
| Raw Eventstream | 799.2 | 0.222 | 11.1% | 2.775% | 0.35% |
| ES w. 20KB sample data – No Output | 800.3633 | 0.2223 | 11.115% | 2.779% | 0.35% |
| ES w. 1MB sample data – No Output | 844.6775 | 0.235 | 11.75% | 2.937% | 0.37% |
Now… What happens if we group the two data sources into one Eventstream?
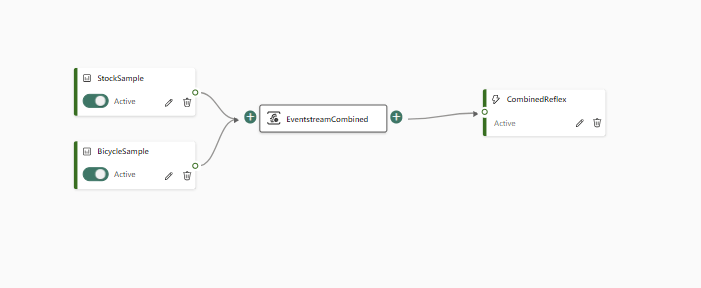
We get an Eventstream which consumes ~892 CU seconds.

And while it is clear to me why we of course save some CU seconds on the Eventstream per Hour cost, I have no clue why the Data Traffic doubles, in this case. I would have expected to see a Data Traffic consumption of 45-46 CU seconds.

| CU Seconds per hour | CU’s per hour | % of F2 Capacity | % of F8 Capacity | % of F64 Capacity | |
| Raw Eventstream | 799.2 | 0.222 | 11.1% | 2.775% | 0.35% |
| ES w. 20KB sample data – No Output | 800.3633 | 0.2223 | 11.115% | 2.779% | 0.35% |
| ES w. 1MB sample data – No Output | 844.6775 | 0.235 | 11.75% | 2.937% | 0.37% |
| ES w. 20KB + 1MB sample data – No Output | 891.6847 | 0.248 | 12.38% | 3.1% | 0.39% |
What happens if we perform some simple transformations in the Eventstream?
I first tried out something simple like use a Filter in the Eventstream, to only get Bicycle Events for a single Neighborhood.
The result? The Data Traffic CUs went down from 1.1633 to 0.5043. Not a huge difference.
In another test, I added a simple aggregation, and the Data Traffic CU usage went up a tiny bit from 1.1633 to 1.3556. In the grand scheme of things, this is negligible.

| CU Seconds per hour | CU’s per hour | % of F2 Capacity | % of F8 Capacity | % of F64 Capacity | |
| Raw Eventstream | 799.2 | 0.222 | 11.1% | 2.775% | 0.35% |
| ES w. 20KB sample data – No Output | 800.3633 | 0.2223 | 11.115% | 2.779% | 0.35% |
| ES w. 1MB sample data – No Output | 844.6775 | 0.235 | 11.75% | 2.937% | 0.37% |
| ES w. 20KB + 1MB sample data – No Output | 891.6847 | 0.248 | 12.38% | 3.1% | 0.39% |
| ES w. 20KB sample data w. Filter – no Output | 799.5043 | 0.222 | 11.1% | 2.775% | 0.35% |
| ES w. 20KB sample data w. Group – no output | 800.5556 | 0.222 | 11.1% | 2.775% | 0.35% |
Eventhouse Consumption
Now, you may have noticed how Connector Per vCore-hour and Processor Per Hour is 0 in the example above. Connector Per vCore-hour comes into play when connecting to an actual Real Time data source instead of a sample, and Processor comes into play when we start outputting data.
I do not currently have access to any Azure Event Hub / IoT streaming data sources, and hence am unable to investigate the Connector consumption further here.
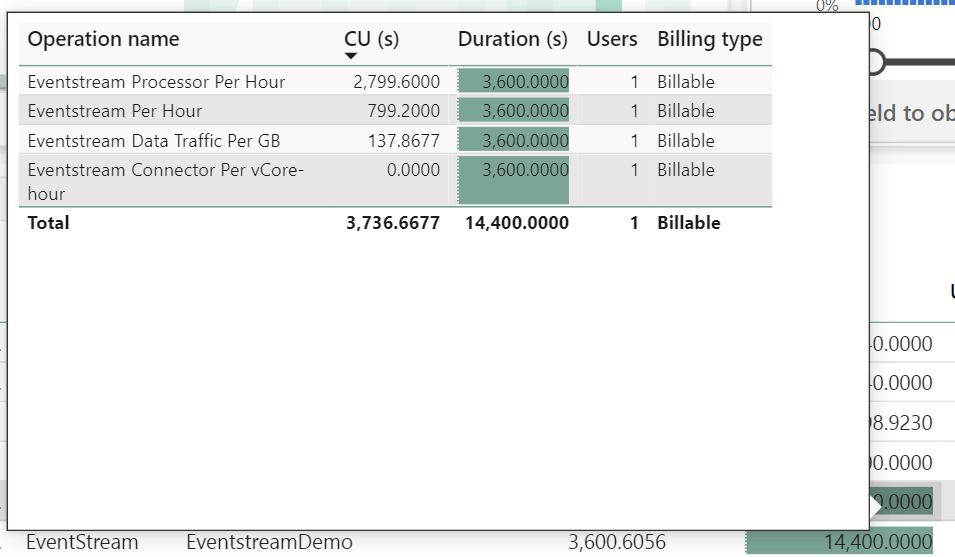
For Processing however, if we add an Eventhouse output to either the High or Low Volume Eventstream, we can see that the Eventstream now consumes 2799,6 CU seconds over the course of an hour.
This equates 2799,6/3600 = 0.778 CU pr. hour, which again is exactly what is listed in the documentation for a low throughput eventstream (the default setting for eventstreams). This will double or triple for medium and high throughput eventstreams: Microsoft Fabric event streams capacity consumption – Microsoft Fabric | Microsoft Learn
In addition. Note that the Data Traffic actually increased simply by adding an Eventhouse destination. Curious…. And while this has very little impact on the Low Volume stream, the increase is more significant for the high value stream as you can see below.
Low Volume Eventstream, Outputting to Eventhouse:

High Volume Eventstream, Outputting to Eventhouse:
| CU Seconds per hour | CU’s per hour | % of F2 Capacity | % of F8 Capacity | % of F64 Capacity | |
| Raw Eventstream | 799.2 | 0.222 | 11.1% | 2.775% | 0.35% |
| ES w. 20KB sample data – No Output | 800.3633 | 0.2223 | 11.115% | 2.779% | 0.35% |
| ES w. 1MB sample data – No Output | 844.6775 | 0.235 | 11.75% | 2.937% | 0.37% |
| ES w. 20KB + 1MB sample data – No Output | 891.6847 | 0.248 | 12.38% | 3.1% | 0.39% |
| ES w. 20KB sample data w. Filter – no Output | 799.5043 | 0.222 | 11.1% | 2.775% | 0.35% |
| ES w. 20KB sample data w. Group – no output | 800.5556 | 0.222 | 11.1% | 2.775% | 0.35% |
| Raw Eventhouse Output | 2799.600 | 0.778 | 38.9% | 9.73% | 1.22% |
| ES w. 20KB sample data – Eventhouse Output | 3600.52 | 1.0001 | 50% | 12.5% | 1.56% |
| ES w. 1MB sample data – Eventhouse Output | 3736.67 | 1.038 | 51.9% | 12.97% | 1.62% |
But that’s not all. In addition to the Eventstream consumption, the Eventhouse itself consumes a very high amount of CUs. The consumption will vary depending on your Capacity Size and the number of KQL databases in it. There is autoscaling in place, and it is not that easy to wrap your head around…: Eventhouse and KQL Database consumption – Microsoft Fabric | Microsoft Learn
But on my F8 capacity, a single eventhouse with a single KQL database, running for an hour consumed: 22500 CU seconds = 6,25 CU per hour = 78,1% of my F8 Capacity.

| CU Seconds per hour | CU’s per hour | % of F2 Capacity | % of F8 Capacity | % of F64 Capacity | |
| Raw Eventstream | 799.2 | 0.222 | 11.1% | 2.775% | 0.35% |
| ES w. 20KB sample data – No Output | 800.3633 | 0.2223 | 11.115% | 2.779% | 0.35% |
| ES w. 1MB sample data – No Output | 844.6775 | 0.235 | 11.75% | 2.937% | 0.37% |
| ES w. 20KB + 1MB sample data – No Output | 891.6847 | 0.248 | 12.38% | 3.1% | 0.39% |
| ES w. 20KB sample data w. Filter – no Output | 799.5043 | 0.222 | 11.1% | 2.775% | 0.35% |
| ES w. 20KB sample data w. Group – no output | 800.5556 | 0.222 | 11.1% | 2.775% | 0.35% |
| Raw Eventhouse Output | 2799.600 | 0.778 | 38.9% | 9.73% | 1.22% |
| ES w. 20KB sample data – Eventhouse Output | 3600.52 | 1.0001 | 50% | 12.5% | 1.56% |
| ES w. 1MB sample data – Eventhouse Output | 3736.67 | 1.038 | 51.9% | 12.97% | 1.62% |
| Raw Eventhouse Uptime | 22500 | 6.25 | 312.5% | 78.1% | 9.77% |
| ES 20KB Sample w. Output + Eventhouse Uptime | 26100.02 | 7.25 | 362.5% | 90.63% | 11.33% |
| ES 1MB Sample w. Output + Eventhouse Uptime | 26226.67 | 7.285 | 364.26% | 91.06% | 11.38% |
In total, that means that one Eventstream and one Eventhouses now consume 90% of my F8 capacity!
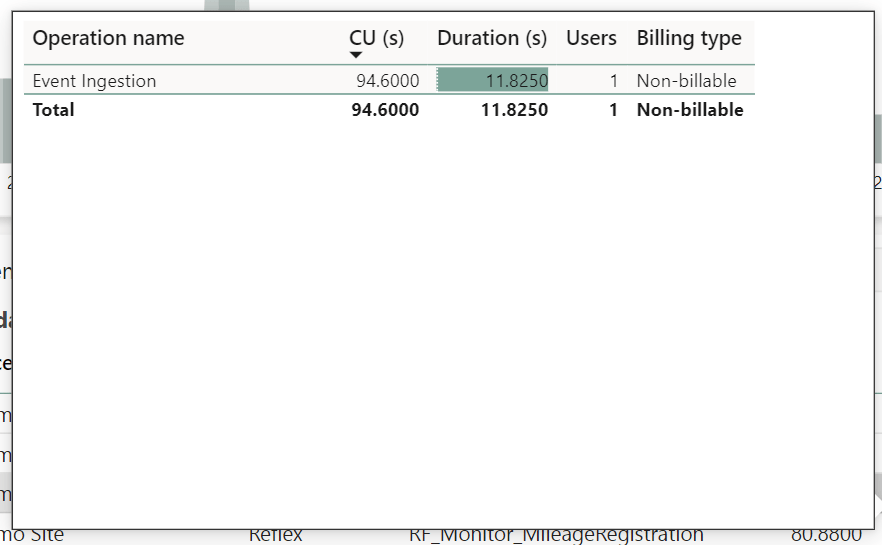
As an extra note, curiously, all of my above Eventstream tests which only use Reflexes as output destinations, do not consume any CUs for Processing on the Eventstream. The Reflexes themselves do have a small CU consumption listed for Event Ingestion, as well as Event Computation and Rule Uptime but, they are still feasible on small capacities. Also note that while the Billing Type says non-billable, this is likely due to Reflexes still being in Preview at the time of testing this.
High Volume Ingestion into Reflex:

Low Volume Reflex Ingestion (which for some reason appears exactly double that of the High Volume… Unsure what is happening here…):
Fabric Events Reflex:

| CU Seconds per hour | CU’s per hour | % of F2 Capacity | % of F8 Capacity | % of F64 Capacity | |
| Raw Eventstream | 799.2 | 0.222 | 11.1% | 2.78% | 0.35% |
| ES w. 20KB sample data – No Output | 800.3633 | 0.2223 | 11.12% | 2.80% | 0.35% |
| ES w. 1MB sample data – No Output | 844.6775 | 0.235 | 11.75% | 2.94% | 0.37% |
| ES w. 20KB + 1MB sample data – No Output | 891.6847 | 0.248 | 12.38% | 3.1% | 0.39% |
| ES w. 20KB sample data w. Filter – no Output | 799.5043 | 0.222 | 11.1% | 2.78% | 0.35% |
| ES w. 20KB sample data w. Group – no output | 800.5556 | 0.222 | 11.1% | 2.78% | 0.35% |
| Raw Eventhouse Output | 2799.600 | 0.778 | 38.9% | 9.73% | 1.22% |
| ES w. 20KB sample data – Eventhouse Output | 3600.52 | 1.0001 | 50% | 12.5% | 1.56% |
| ES w. 1MB sample data – Eventhouse Output | 3736.67 | 1.038 | 51.9% | 12.97% | 1.62% |
| Raw Eventhouse Uptime | 22500 | 6.25 | 312.5% | 78.1% | 9.77% |
| ES 20KB Sample w. Output + Eventhouse Uptime | 26100.02 | 7.25 | 362.5% | 90.63% | 11.33% |
| ES 1MB Sample w. Output + Eventhouse Uptime | 26226.67 | 7.285 | 364.26% | 91.06% | 11.38% |
| Raw Reflex Rule Uptime | 79.92 | 0.0222 | 1.11% | 0.28% | 0.03% |
| Reflex Event Ingestion on 1MB data | 47.88 | 0.0133 | 0.67% | 0.17% | 0.02% |
| ES 1MB Sample w. Output to Reflex w. 1 rule | 972.4775 | 0.27 | 13.5% | 3.38% | 0.42% |
Reflections
It’s probably not fair to say that things can’t be optimized further than what I do here… But on the other hand, I represent a pretty average self-service user with access to Fabric. But with that in mind, I find the above pretty telling:
The tests above show that:
- Data Volumes only impact Eventstream CU consumption a little.
- Data Transformations only impact Eventstream CU consumption a little.
- Creating multiple Eventstreams is expensive, as each has a start up cost. Consider grouping together sources in one stream and use clever filtering/routing to split them into different outputs as needed.
- Outputting data to Eventhouses is expensive and not feasible on small capacities.
- Creating multiple Eventhouses is even more expensive. Consider grouping whenever possible.
- Outputting to Reflexes appears to be cheap, with minimal costs associated even with triggers and actions.
All in all, Eventstreams actually work pretty fine on small capacities, even with large data quantities, as long as you don’t output the data to Eventhouses, but stick to reflexes.
This is of course a pretty large downside, but on the other hand you can readily encourage your users to go crazy on reflexes and data driven notifications.


Leave a comment