Introduction
If you are looking for an easy to set up solution to monitor events in one or more Fabric Workspaces that you are responsible for, you can look into using Data Activator / Reflexes with the built-in Workspace Item Events data stream.
In this blog we will explore how to connect and use this data, and give you a quick tour of the updated Data Activator / Reflex UI.
Setting up Event Monitoring on a Workspace
To get started, create a new Reflex in a workspace. This does not need to be in the workspace that you intend to monitor!

First we need to select the data to use in the Reflex. Select “Get Data”. to be prompted with a menu to connect to your data sources:

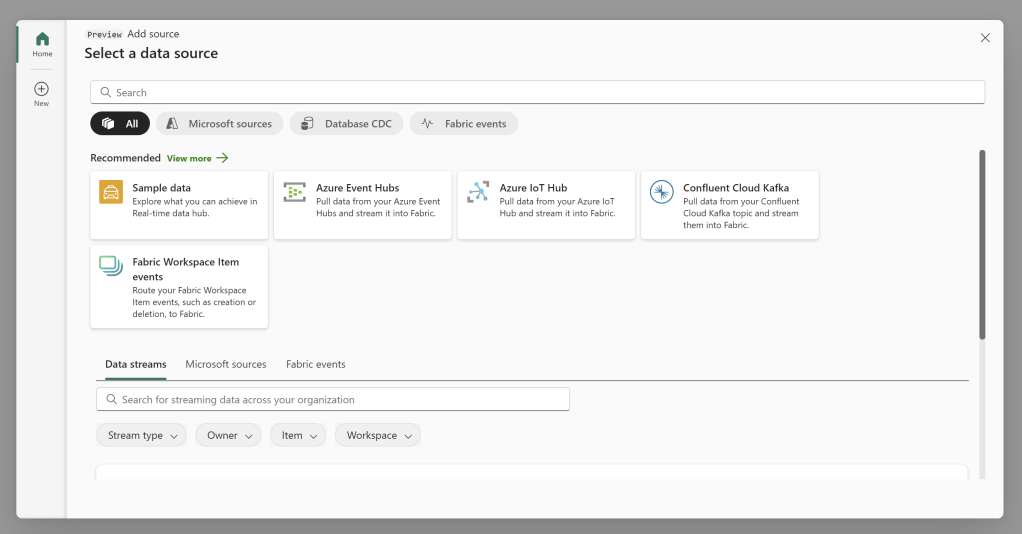
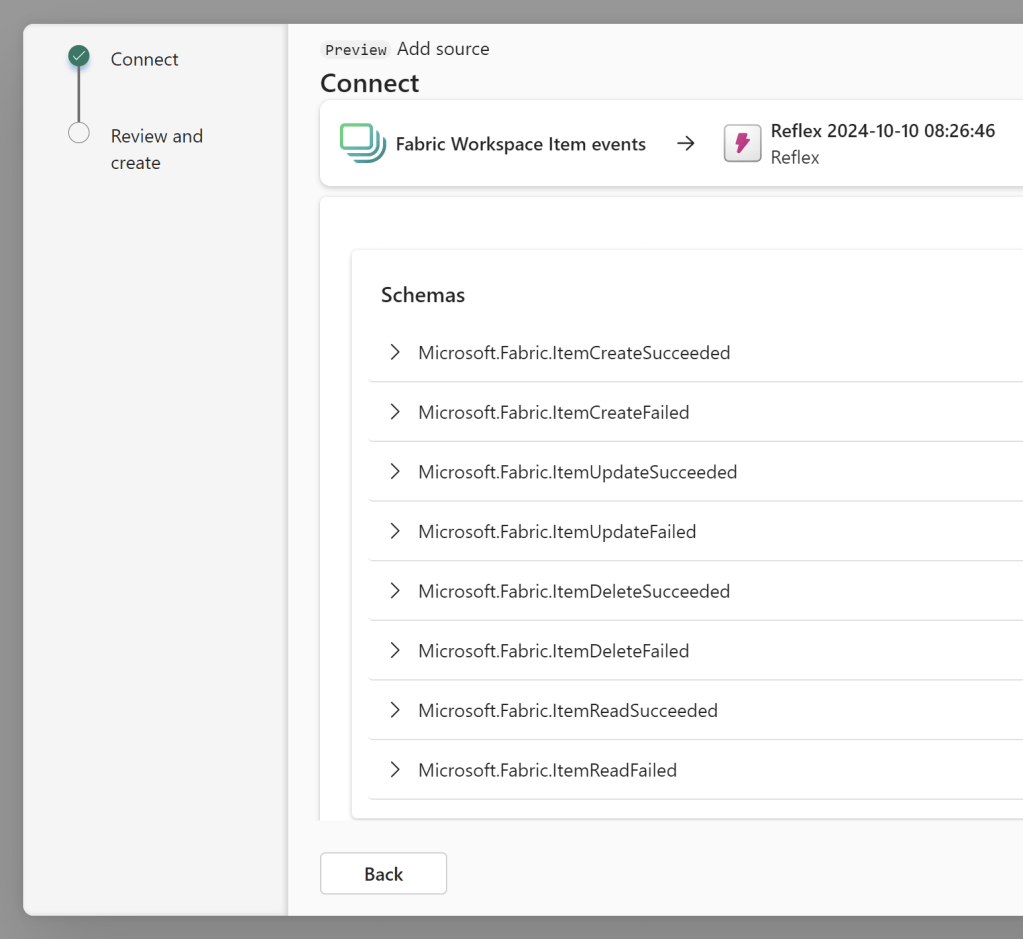
If you select “Fabric Workspace Item Events”, you’ll be able to select which workspace to monitor, and explore the schema of the different event types further:
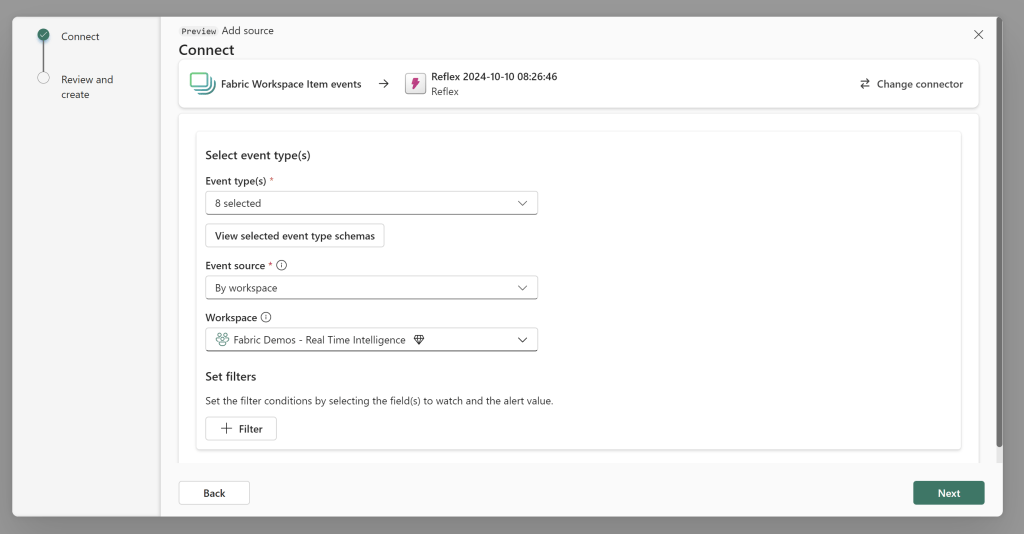
As well as set up filters, to e.g only get the failed events:

Clicking Save will connect your Reflex to the Fabric Workspace Item Event data for the selected workspace, and you’ll find yourself in front of the updated Data Activator interface:

Creating Alerts on your Events
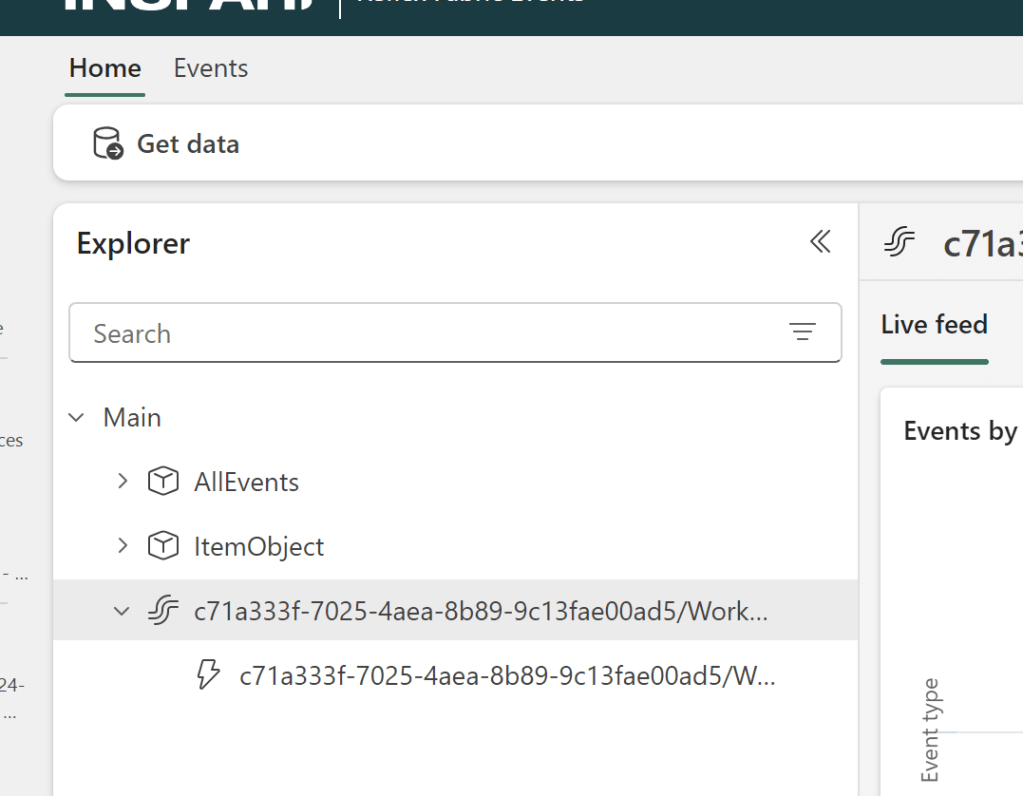
In the new interface, you can see your Data Stream, Objects and Rules in the left hand ‘Explorer’ pane. To the right, you can see a neat interactive Live Feed of your selected item, see sample data and explore simple analytics.
If we create a new rule, it will appear in the left hand Explorer Pane, and a panel pops out to the right, allowing us to specify the rule:
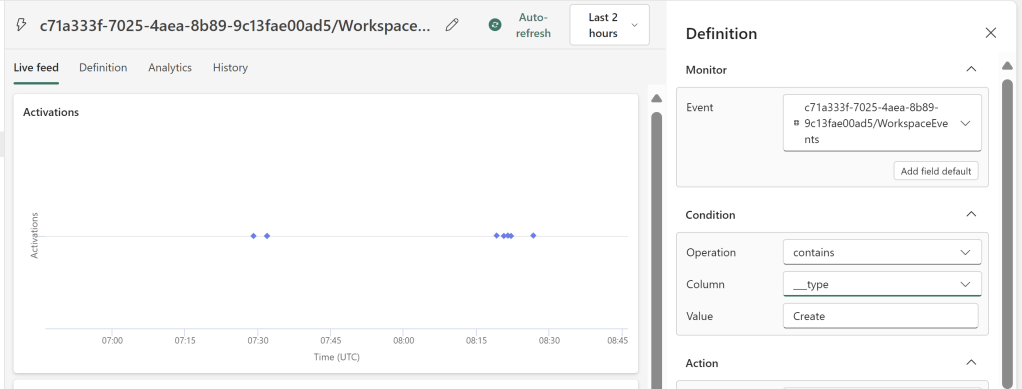
For example, I may wish to create a condition which checks if the Event Type contains the string “Create”:
Similarly, I could set this up to look for “Failed” events, but as I have no failed events currently, this does not make sense to show.
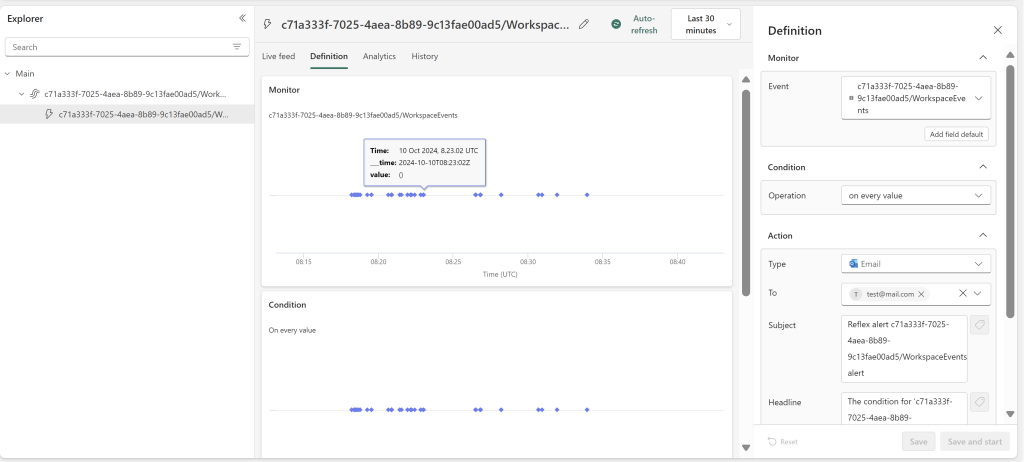
Finally, configure the Action by altering the Headline and Message properties, and you can see a neat overview on the left of the Actions that would have been triggered by this Rule within the selected time period:
Using Objects
Now, creating your rule directly on the Stream only allows for very simple alerts. If you wish to include Properties to dynamically analyze and act on the data stream, we need to first create an Object with Properties to monitor.
If we click our Data Stream again, we can either create an object by selecting New Object in the top left corner, or towards the bottom right corner of the screen in the Event Details box:

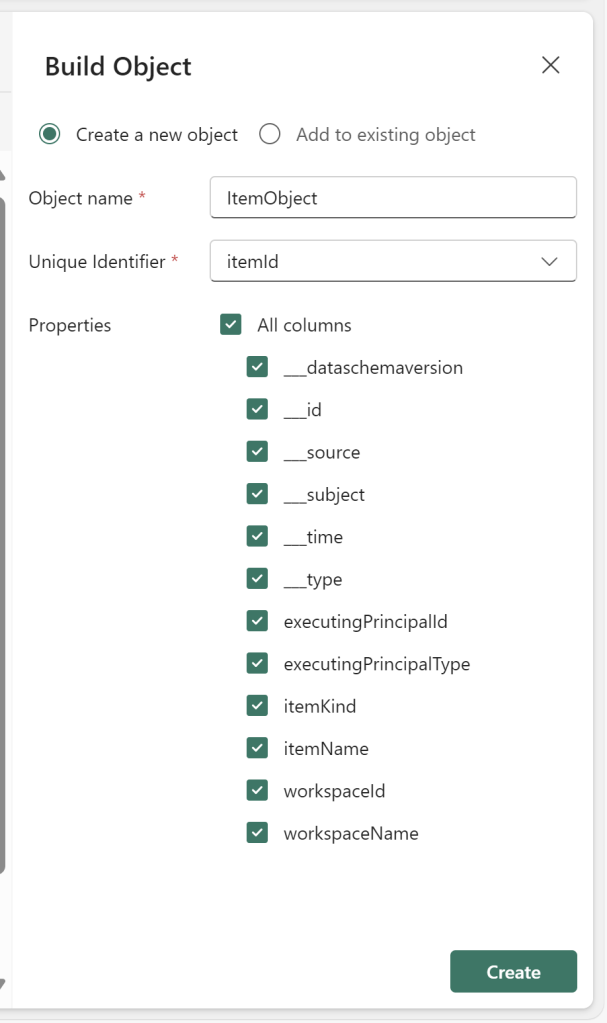
Another fly out menu allows us to specify the Identifier needed to group the objects, and we can select which Properties to include:
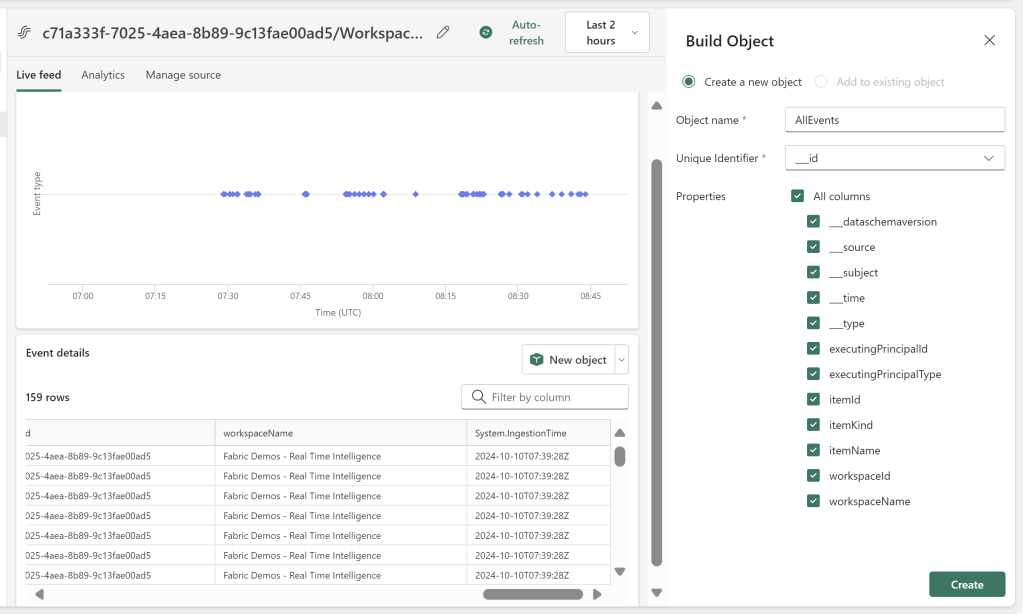
Using the ‘___id’ column might not be desirable, as this will create an object in which we analyze each specific Event as a separate entity.
Instead, if I want to roll up/group events into an Object of e.g. Items, I can specify another Identifyer:
And we will now be able to analyze each Item in the workspace as a separate stream of events:
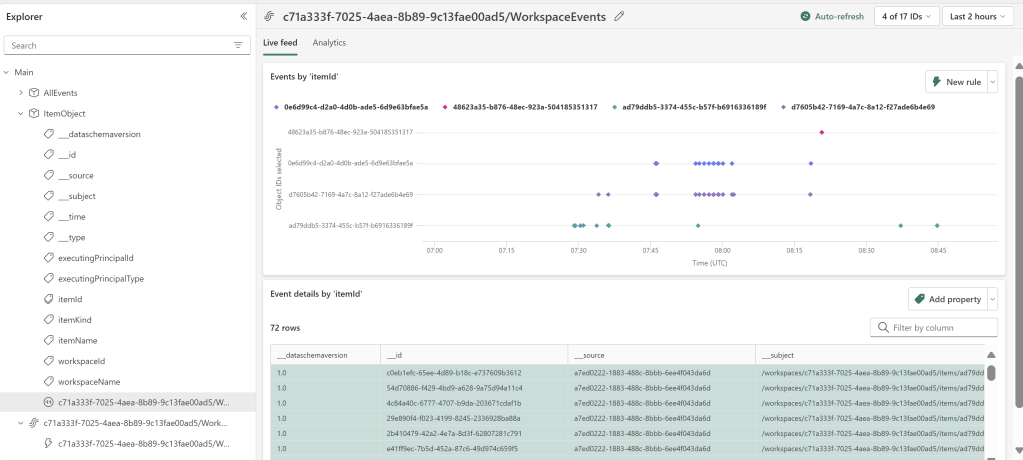
Now if I select a property to monitor, and create a rule, I can see that the Rule in the Explorer pane appears nested under the Object instead of directly on the Data Stream. Further, I have a very easy to follow overview of my incoming events on the objects, as well as how many events are left under my specified conditions:
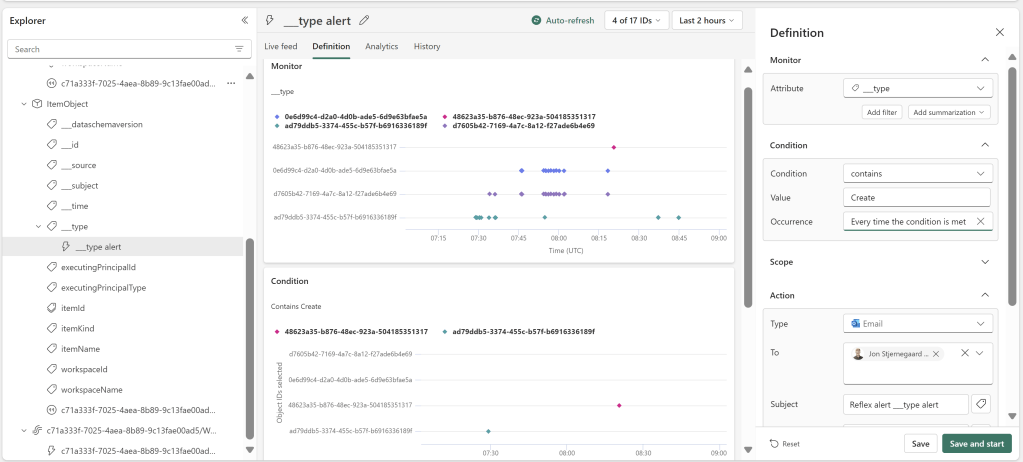
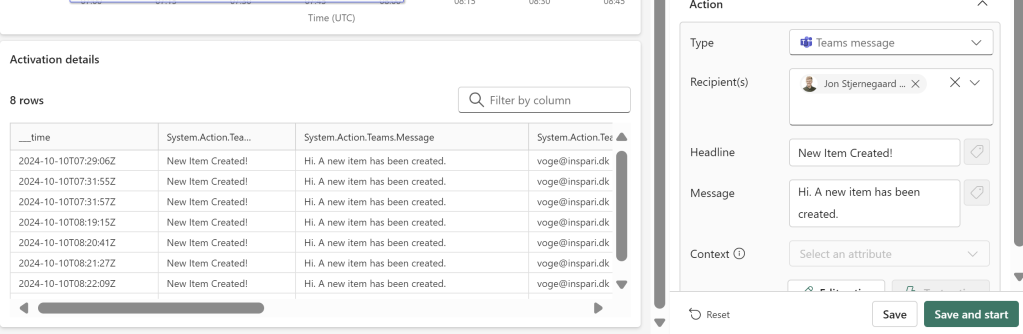
When I now setup my Action, I can use the properties of my Object to dynamically alter the action. I could use this to send dynamic messages, or to execute dynamic Fabric Items (Notebooks and Pipelines). Your imagination is the limit here:

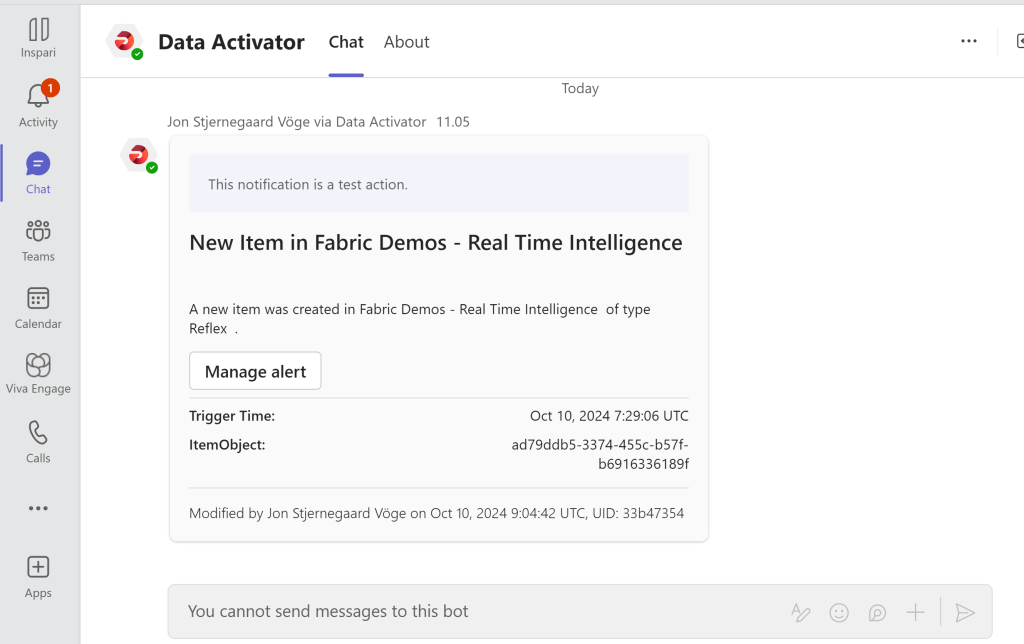
Testing the Action I get the following:
Adding Multiple Workspace Item Event data streams
If you go to the Home tab of your Reflex, you are able to click “Get Data” to add more data streams for multiple Workspaces if you wish to consolidate them into one Reflex. This is useful, if you don’t want to maintain tens or hundreds of Reflex items to monitor all your workspaces:
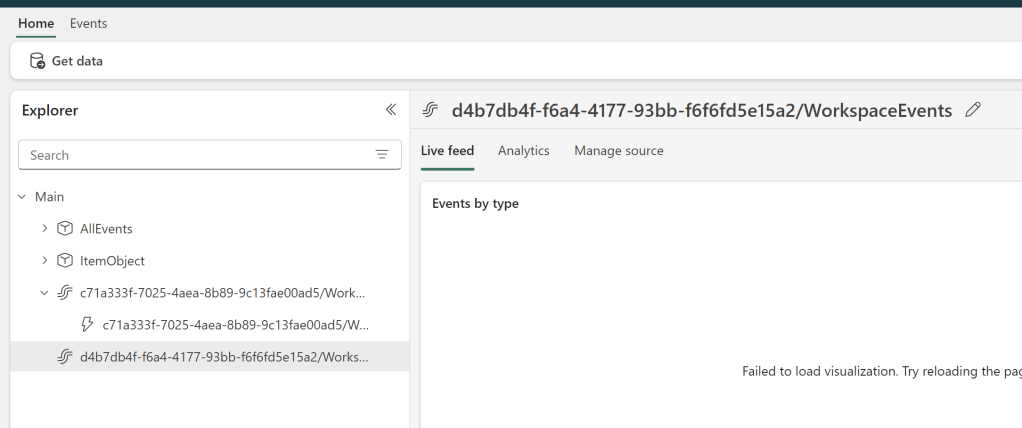
The downside is, that Objects don’t seem to be nested within the Stream that they are created from. Don’t forget to rename your data streams, objects and rules if you decide to do this:

Usage Scenarios
I think the obvious use cases for monitoring your Fabric Events like this, is at least the following two:
Monitoring Critical Workspaces and Items
If you have business critical items in your tenant, you can leverage these events to easily be notified if a user has a Read Error on e.g. a Power BI Report.
Simply create an Object grouped on the Item ID like I did in this post, and create filters and conditions to monitor the item type and event type that is important for you to be alerted of.
This would allow you to e.g quickly identify reports which have broken, to identify and fix the problem.
Also, you may want to monitor things like Items being deleted from your business critical workspaces, or failed actions in general.
Supporting Self-Service users
It might also be useful to monitor the creation of Fabric Items for the purpose of nurturing and enablement.
You may create conditions to look for the event type ItemCreateSucceeded in designated Self Service workspaces to identify newcomers to your self-service platforms, and help guide them towards communities, best practices and process documentation.
Conclusion
While there are other ways to get information about Workspace Item Events in Fabric, this is by far the most low-code approach that I have seen. It provides a great way for Admins or even just Workspace Owners to monitor Item Events in one or more workspaces that they are responsible for.
Do you have any cool use cases for this feature?


Leave a comment