Introduction
Every developer knows the pain of delivering a solution and seeing it go unused. Whether it is that complex Power BI Report that you spent hours on, or that App you created, which is an intuitive masterpiece, chances are that your users will be hesitant to open them, if they need to do so in an unfamiliar place.
But guess what is a familiar place? Power Point!
What if I told you that:
- You can embed fully interactive and live updated Power BI reports directly in your Power Point files?
- These embedded Power BI Reports may also include embedded Power Apps, which allows the end user to interact directly with your underlying databases?
This article will teach you how to accomplish both.
1. Create a Power BI Report with an Embedded Power App
Your first step is to create a Power BI Report with an embedded Power App, that we want to embed in PowerPoint.
Do you have a report that you want to integrate in PowerPoint already? Great! You can skip to the next section.
If you do not, go ahead and follow my guide below on the subject, to create a Power App, and integrate it directly in your Power BI Reports: Guide: Adding Write Back capabilities to your Power BI reports with Power Apps – Part 1: Getting Started – Downhill Data (downhill-data.com)
FAQ:
- The Power App can use any data source you’d like. Sharepoint, Dataverse, SQL Server – you name it.
- The Power BI Report must be placed in a non-personal workspace (anything besides your default “My Workspace” will work.
- You must be logged in to PowerPoint with the same account you are using with Power BI.
2. Add your Power BI Report to your Power Point Presentation
Next, we want to connect our Power BI Report to PowerPoint.
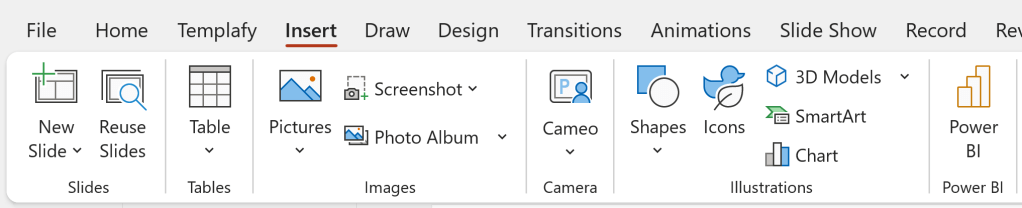
First, open up PowerPoint and locate the Add-ins section of the top Ribbon:

Click “Get Add-ins”, and install the Microsoft Power BI Add-in for PowerPoint:

Select the newly installed Add-in from “My Add-ins” to add it to your Power Point Slide:
After loading, you’ll be greeted with an interface asking for a URL. Simply copy-paste the URL of the report you wish to embed, and hit Insert:
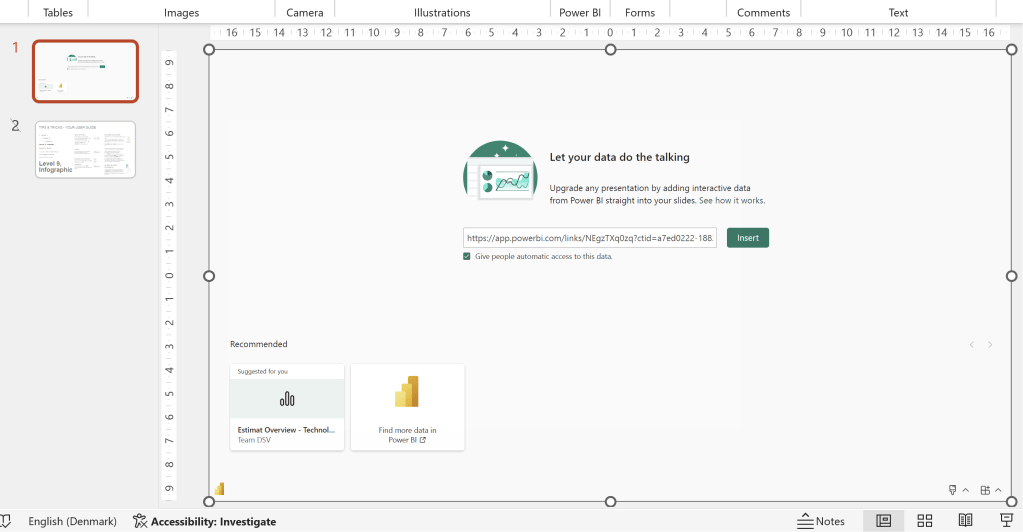
Note the little check mark below the URL Box. That is the brand new February 2024 feature, which improves the experience of sharing the embedded Power BI report with the recipients of the slide deck: Add a live Power BI report page to PowerPoint – Power BI | Microsoft Learn
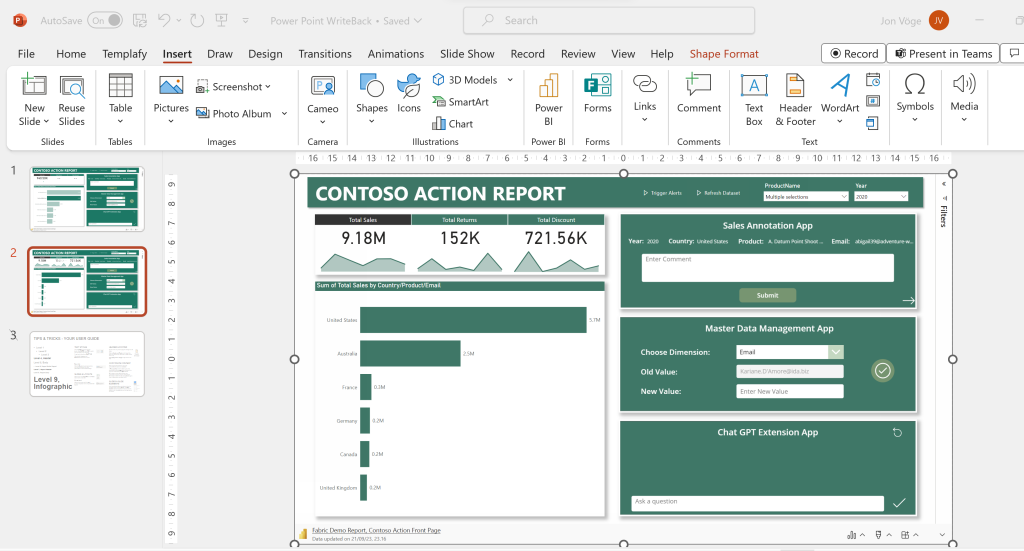
That’s it! You now have a fully functioning Power BI Report inside of Power Point. And YES! The embedded Power App is working too, and will write your input to its underlying data source:

You even have options for:
- Showing/Hiding the Filter Pane
- Refreshing the data (especially useful for reports running DirectQuery
- Running AI driven Insight generation

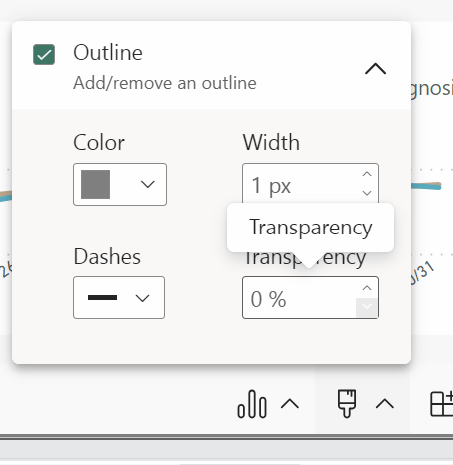
Recent changes further added the possibility to add an outline around your report as well:
3. Use Cases for embedding Power BI / Power Apps in PowerPoint
Use Case 1: Comment on Power BI Reports directly in PowerPoint
In the example above, I have embedded a Power BI Report of a Profit & Loss Statement, which includes a simple Power App for writing comments on the selected period and department, for other users to see.
This live P&L dashboard can easily be integrated into, and enhance any C-Level presentation, Finance Analysis, or anything else you would use PowerPoint for.
The Power BI Report would reflect all the latest data, and the integrated Comment Power App would reflect the analytics team’s latest comments on what is being presented.
Use Case 2: Live What If?-analysis during presentations
If you have embedded your Power App into a Power BI Report feeding off a DirectQuery-ready data source, so that your Write-Back data is reflected live in the report (Learn how to here: Guide: Add Write-Back to Power BI reports with Power Apps – Part 2: Display write-back data LIVE in Power BI reports – Downhill Data (downhill-data.com), you can leverage this live connection inside PowerPoint too.
You could imagine a scenario where you are inputting Budget or Forecasting numbers into a Power App, where this data is then used in your Power BI report and its calculations. This interaction could now be done inside of PowerPoint with the integration seen in this article.
Summary
Integrating Power BI Reports and Power Apps into PowerPoint is as easy as can be, and allows you to supercharge your presentations with Live Reports and Data Write-Back.
Reach out if you have questions, or interesting use cases to share.


Leave a reply to Live Data Write-Back to Fabric Data Warehouse from Power BI w. Power Apps and Power Automate – Downhill Data Cancel reply