Creating Measure Tables in Microsoft Fabric Semantic Models

Measure Tables have long been used to store Measures in Power BI Semantic Models.

However, in Microsoft Fabric, where most of the data modeling takes place in the browser, at least if we wish to reap the benefits of the DirectLake storage mode, the process of creating Measure Tables are slightly different.

Step 1: Creating an empty table

First you need to create an empty table. Or rather, a table with one column in it (a table can’t have zero columns in Fabric), but you should not add any data to this table.

If the Data Lakehouse is your weapon of choice, you may use a Notebook to do so with Python:

data = [(1, 'MeasureTable')]
columns = ['ID', 'Col1']

measure_df = spark.createDataFrame(data, columns)
measure_df.show()

spark.sql("DROP TABLE IF EXISTS MeasureTable")
measure_df.write.format("delta").saveAsTable('MeasureTable')

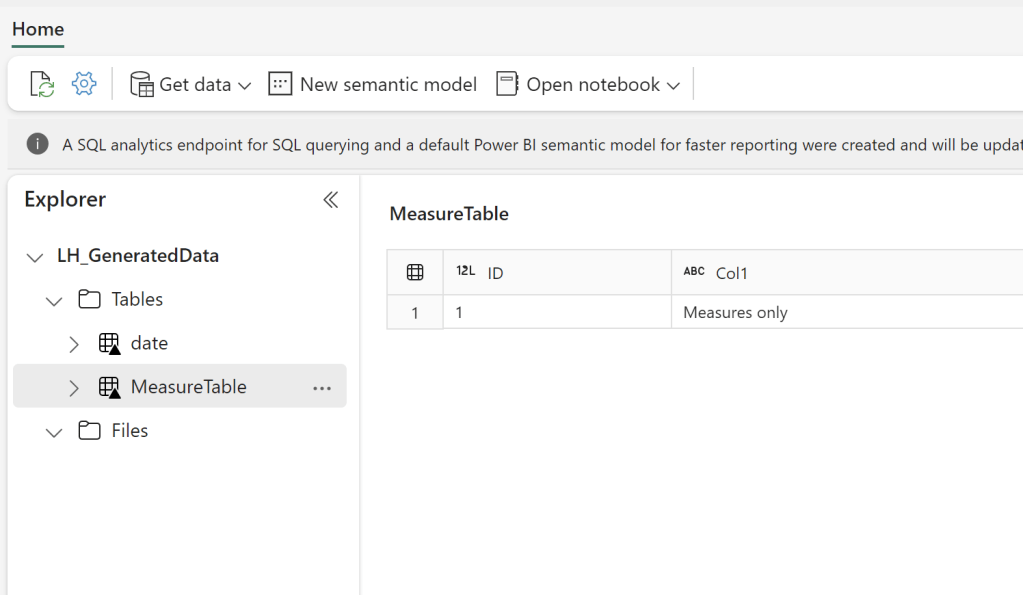
If you are using the Lakehouse SQL Endpoint you can create an empty view, or if you are using Data Warehouse, create a table with SQL:


Step 2: Pulling the table into your Semantic Model

The next step is to create a Semantic Model on top of your Warehouse or Lakehouse:

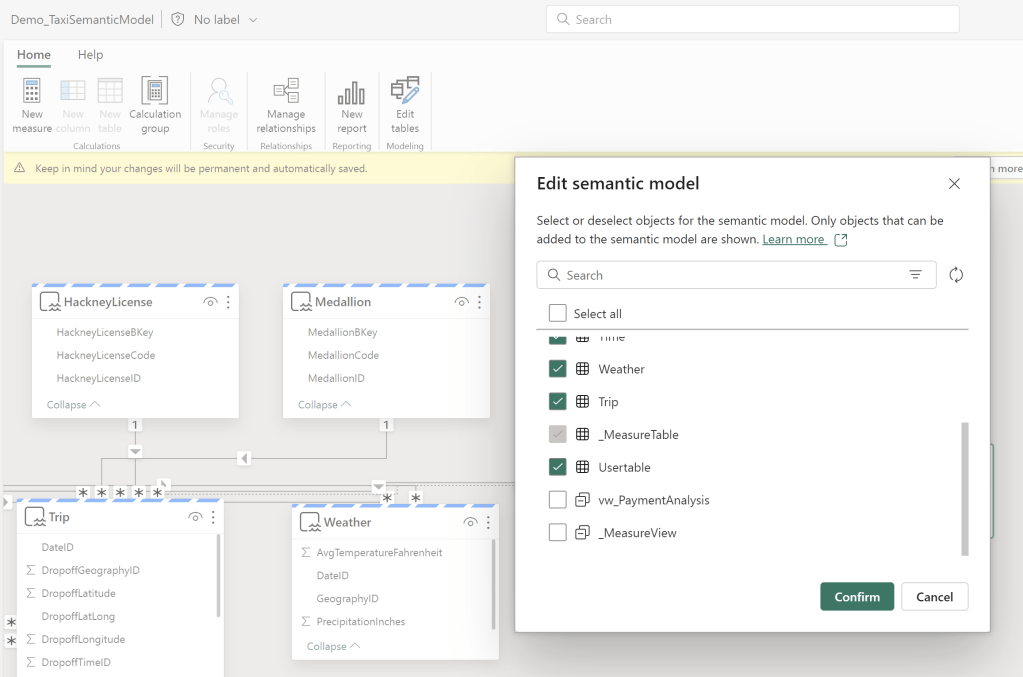
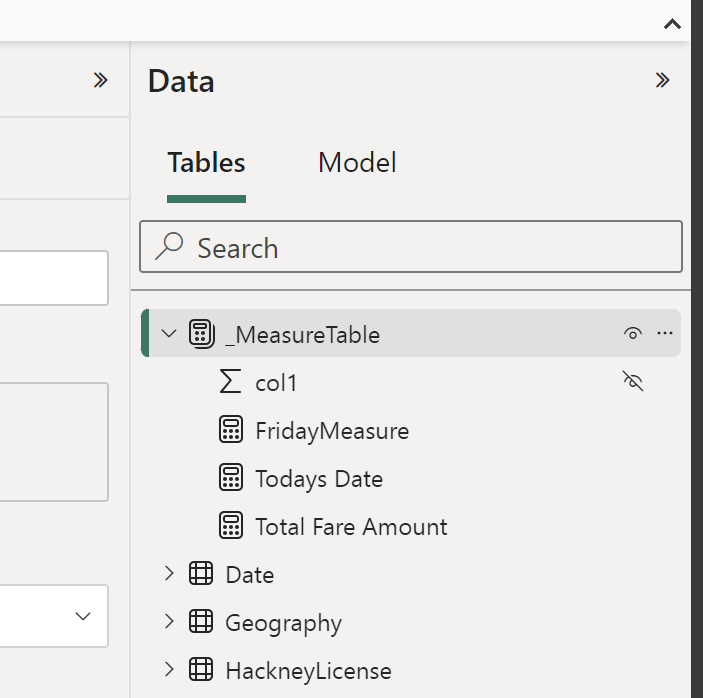
And subsequently, add a couple of measures, before finally hiding the only column present in the table, to convert it into a Measure Table:

And there you have it! It is that simple to create centralized measure tables in your Microsoft Fabric semantic models. Go build!

Also check out these other blogs:

Bulk Write-Back w. Translytical Task Flows in Microsoft Fabric / Power BI: Writing a single value back to multiple records at the same time

Introduction On this blog we’ve previously covered quite a few areas of Translytical Task Flows: Having presented a few sessions on Translytical Task Flows at conferences in the past moths, there is one major recurring question: How do you write-back multiple records at once? If you ask me, the questions of bulk write-back/writing back multiple…

Fabric Quick Tips – Pushing transformation upstream with Self Service Views and Tables in Visual Queries for Lakehouses/Warehouses/SQL DB

Introduction Recently, I’ve experienced a huge influx in requests from Microsoft Fabric customers wanting a good way for user’s to push data transformation upstream, following Roche’s Maxim: Data should be transformed as far upstream as possible, and as far downstream as necessary. To elaborate slightly, there are tons of Power BI Semantic Models out there…

Organizing your Microsoft Fabric Data Platform: Tags and Task Flows

Introduction We’ve arrived at the final level of detail in our series on Organizing your Microsoft Fabric Data Platform. So far we’ve covered, from broadest to narrowest scope: This time we go all the way down to the Item level on our platform, and describe strategies for labeling and categorising individual items by using Tags…

Something went wrong. Please refresh the page and/or try again.

2 responses to “How to create Measure Tables in Microsoft Fabric”

  1. So weird that there’s not a standard Measure table in the model and that you instead have to create an empty table and push that around in your deployments as well.

    Like

  2. […] I wrote a blog post on creating Measure Tables in Fabric Data Lakehouses directly in the browser: How to create Measure Tables in Microsoft Fabric – Downhill Data (downhill-data.com). Back then, Data Warehouses were less relevant for the story, as they could not be used for Direct […]

    Like

Leave a reply to Creating Measure Tables directly in your Fabric Data Warehouse – Downhill Data Cancel reply